Fig. 2.

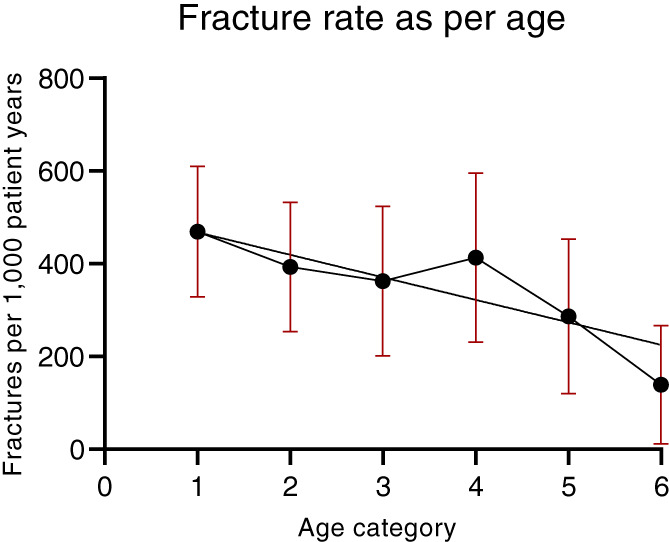
Relationship between age and fracture rate for upper and lower limb fractures. Data are mean and 95% CI by age category. *p < 0.01 compared to group of 0 to <3 years by logistic regression.

Relationship between age and fracture rate for upper and lower limb fractures. Data are mean and 95% CI by age category. *p < 0.01 compared to group of 0 to <3 years by logistic regression.