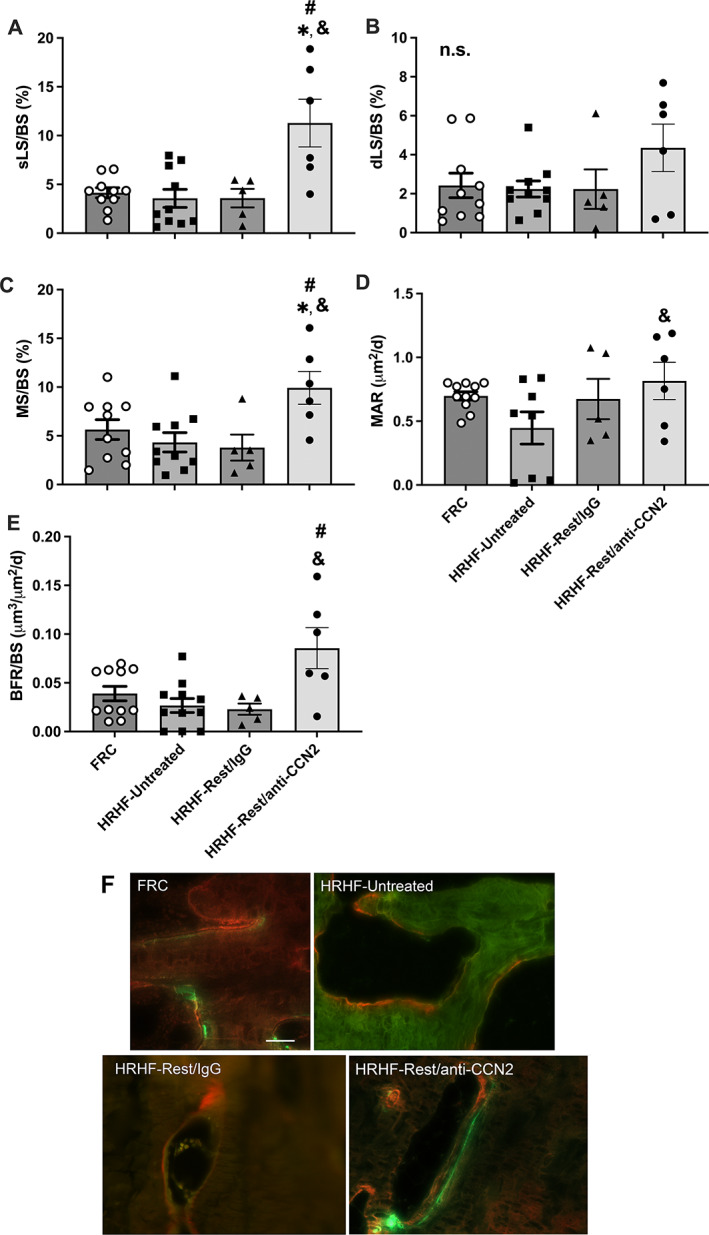
Fig. 5.

Dynamic histomorphometry of the distal radial metaphyseal trabecular bone. (A) Single‐labeled surfaces (sLS). (B) Double‐labeled surfaces (dLS). (C) Mineralizing surface (MS/BS). (D) Mineral apposition rate (MAR). (E) Bone formation rate (BFR/BS). Mean ± SEM shown. *p < 0.05 compared with FRC group; & p < 0.05 compared with HRHF‐Untreated group; # p < 0.05 compared with HRHF‐Rest/IgG group. n.s. = no significant difference between groups. (F) Representative images of calcein (green, injected 9 days before euthanasia) and alizarin red (injected 2 days before euthanasia) for each group, taken with a 40× objective. Scale bar (F, top left FRC panel) = 50 μm and is applicable to the other images in F.
