Figure 1.
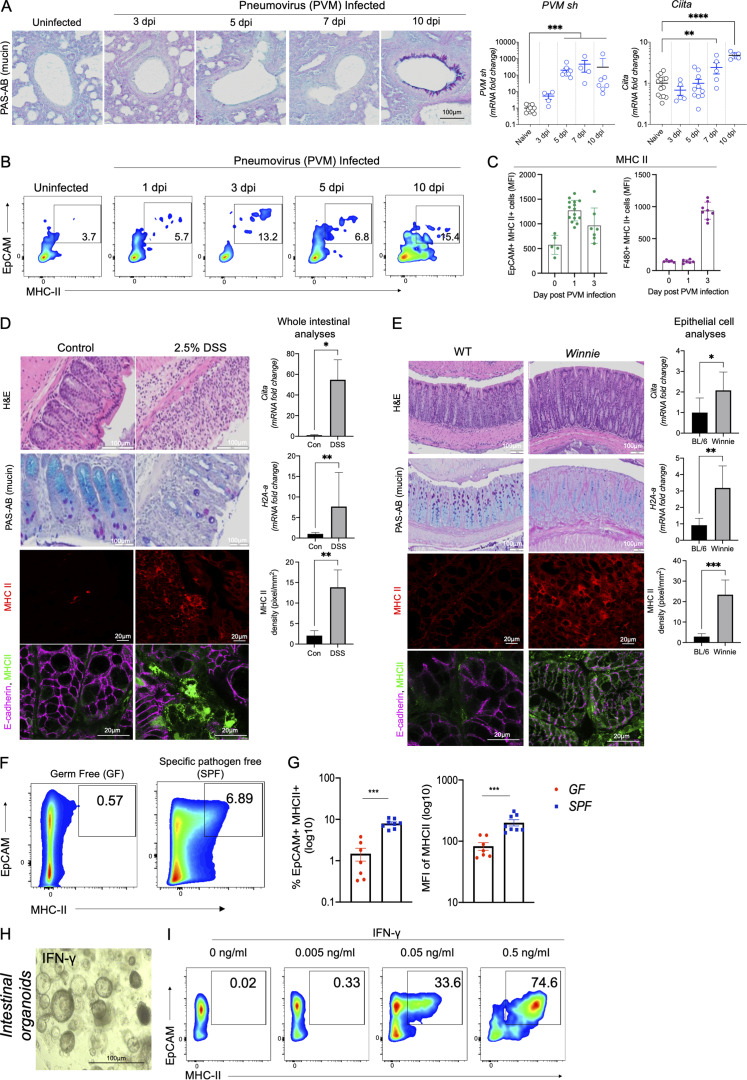
Upregulation of MHC II on mucosal epithelial cells during infection and inflammation. (A) Representative images of respiratory tract histology highlighting mucus-secreting goblet cells (PAS-AB staining) in C57BL/6 animals infected with PVM (10 PFU). PVM small hairpin protein (PVM-sh) and Ciita (MHC II transactivator) mRNA expression levels in whole respiratory tract were assessed by qRT-PCR at indicated dpi. (B) Representative flow cytometric plots. (C) Total MFI of MHC II expressing respiratory tract Epcam+ve and F4/80+ve cells in PVM infected animals on 0, 1, and 3 dpi. (D) Representative colon pathology (H&E), mucin-producing goblet cells (PAS-AB), and MHC II, MHC II/E-cadherin in the intestines of WT mice challenged with DSS (2.5% in drinking water) for 7 d. Colonic mRNA expression of Ciita and H2A-α, and quantitation of epithelial MHC II (pixel/mm2) in WT and DSS-treated animals. (E) Representative colon pathology (H&E), mucin-producing goblet cells (PAS-AB), and MHC II, MHC II/E-cadherin in the intestines of WT mice and Winnie animals with emerging colitis (6–8 wk of age). mRNA expression levels of Ciita and H2A-a from IECs isolated and quantitation of epithelial MHC II (pixel/mm2) from WT and Winnie animals. (F and G) (F) Representative flow cytometric plots, relative frequency, and (G) MFI of colonic MHC II+ve epithelial cells harvested from GF and SPF C57BL/6 mice. (H and I) Intestinal organoids were treated with IFNγ (24 h) with increasing doses and total MHC II assessed using flow cytometry. Statistics: mean ± SEM (n = 4–14); data are representative of two independent experiments. (A and B) One-way ANOVA, Bonferroni’s post hoc test. (C and D) t test; *P < 0.05, **P < 0.01, ***P < 0.001, and ****P < 0.0001.

