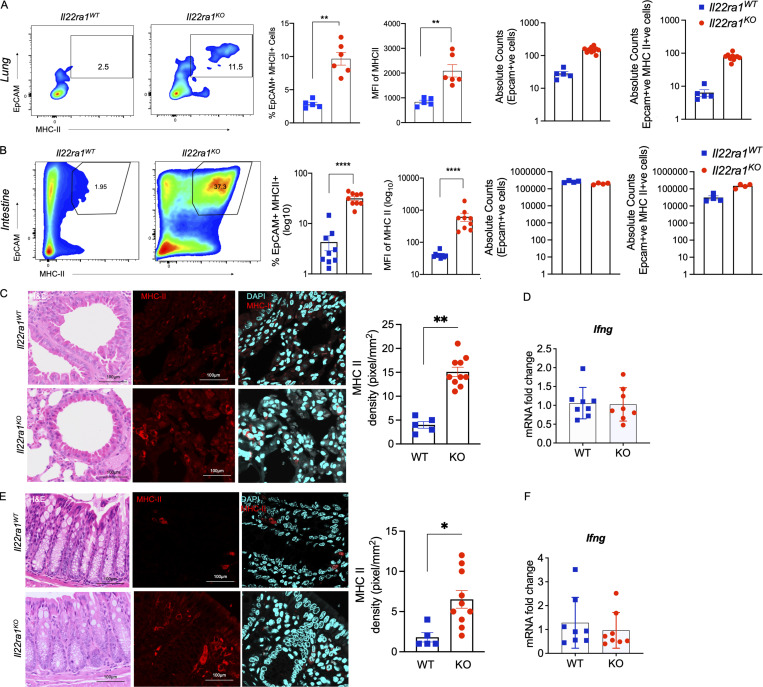
Figure 2.
Endogenous IL-22 suppresses epithelial MHC II. (A and B) Flow cytometry plots of relative frequency, MFI of total MHC II expression, and absolute Epcam+ve and Epcam+ve MHCII+ve counts in lung (A) and colonic (B) epithelial cells isolated from naïve Il22ra1 fl/fl (Il22ra1WT) and CMV-cre × Il-22ra1 fl/fl (Il22ra1KO) mice. (C and E) Representative pathology (H&E) and MHC II expression and quantitation (pixels/mm2) in the lungs (C) and intestine (E) of Il22ra1WT and Il22ra1KO animals. (D and F) mRNA levels of Ifng in the lung (D) and intestine (F) in the of Il22ra1WT and Il22ra1KO animals. Statistics: mean ± SEM (n = 5–9); data are representative of two independent experiments. t test; *P < 0.05, **P < 0.01, and ****P < 0.0001.

