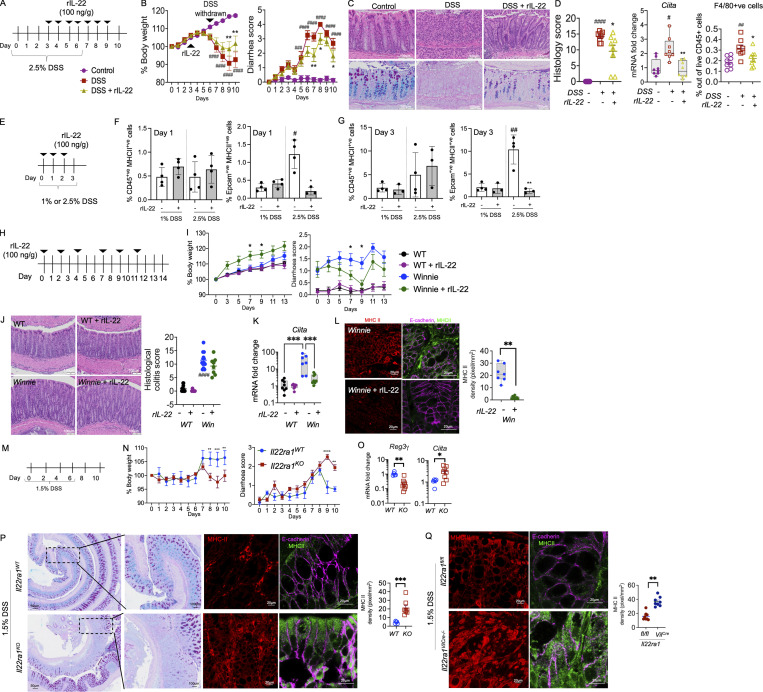
Figure 3.
IL-22–suppressed epithelial MHC II correlates with reduced pathology in chronic colonic inflammation. (A) Schematic representation of the experimental plan; C57BL/6 mice were challenged with 2.5% DSS and a subgroup of animals were treated daily with rIL-22 (100 ng/g/body weight) starting from day 3 (B) Body weight (as % of starting weight) and diarrhea scores. (C) H&E and PAS-AB staining highlighting goblet cells. (D) Blind histological colitis score, Ciita mRNA expression in the intestine, and flow cytometric evaluation of the relative frequency of colonic F4/80+ macrophages. (E–G) Schematic representation of experimental plan (E); C57BL/6 mice were challenged with 1 or 2.5% DSS and MHC II assessed on immune (CD45+ve) or epithelial (Epcam+ve) cells using flow cytometry on day 1 (F) and day 3 (G). (H) Schematic diagram showing Winnie mice with emerging colitis treated with rIL-22 (100 ng/g/body weight) on alternative days for 2 wk prior to sacrifice. (I) Body weight loss and diarrhea score. (J) H&E staining (WT and Winnie same as shown in Fig. 1 E) and blind histological colitis score. (K and L) qRT-PCR showing Ciita mRNA expression (K) and (L) representative images and quantitation (pixels/mm2) of MHC II expression (with and without E-cadherin) in the intestine. (M) Schematic diagram showing DSS (1.5% in drinking water) challenge of Il22raWT (littermate controls) and Il22ra1KO mice for 6 d with a 4-d recovery. (N) Body weight loss and diarrhea score. (O) Colonic mRNA expression levels of antimicrobial peptide Reg3β and Ciita measured by qRT-PCR. (P) PAS-AB and MHC II, MHC II/E-cadherin staining and quantitation in Il22raWT and Il22ra1KO exposed to DSS. (Q) MHC II, MHC II/E-cadherin staining and quantitation in the intestine of Il22raWT and Il22ra1VilCre−/− mice exposed to 1.5% DSS. Statistics: mean ± SEM (n = 6–12); data are representative of three independent experiments. One-way ANOVA, Bonferroni’s post hoc test; #P < 0.05; ##P < 0.01; ###P < 0.001; ####P < 0.0001 compared with control and *P < 0.05; **P < 0.01; ***P < 0.001 compared with DSS group.

