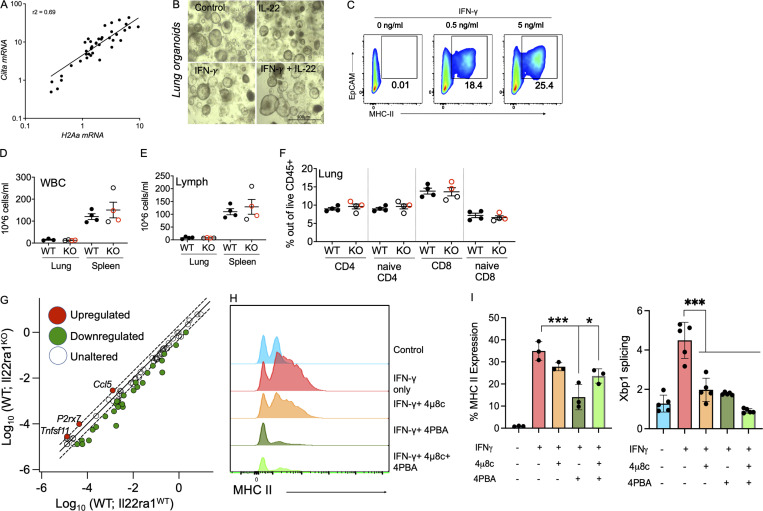
Figure S1.
Inhibition of ER stress partially reduced IFNγ-induced epithelial MHC II. (A) Pearson correlation between log-transformed H2A-a and Ciita gene expression in the lung of PVM-infected C57BL/6 mice. (B) Representative microscopic images of lung organoids treated with IFNγ (5 ng/ml) alone (shown in Fig. 1 H) or in combination with IL-22 (10 ng/ml). (C) Lung organoids were treated with IFNγ in a dose-dependent manner and MHC II assessed using flow cytometry; representative flow cytometric plots shown here. (D and E) Total count of white blood cells (WBC; D) and (E) differential count of lymphocytes measured by Mindray assay in the lung and spleen of 6–8-wk-old Il22ra1 fl/fl (Il22ra1WT) and CMV-cre × Il-22ra1 fl/fl (Il22ra1KO) mice. (F) Flow cytometric relative frequencies of CD4 and CD8 T cells in the lungs isolated from Il22ra1WT and Il22ra1KO mice as in B. Red = female; black = male. (G) Colon from Il22ra1WT and Il22ra1KO mice was analyzed using cytokines and chemokines RT2 Profiler PCR Array. Genes upregulated (red) are annotated. (H and I) Flow cytometry histograms for total MHC II in 16HBEs treated with IFNγ alone or in combination with ER stress inhibitors (4PBA and 4 4µ8c; H) with % MHC II expression (I). (J) mRNA levels of splicing of Xbp1 confirming inhibition with inhibitors. Data are presented as mean ± SEM (n = 3–4). Data are representative of two independent experiments and are presented as mean ± SEM (n = 5–8). One-way ANOVA, Bonferroni’s post hoc test; *P < 0.05 and ***P < 0.001.

