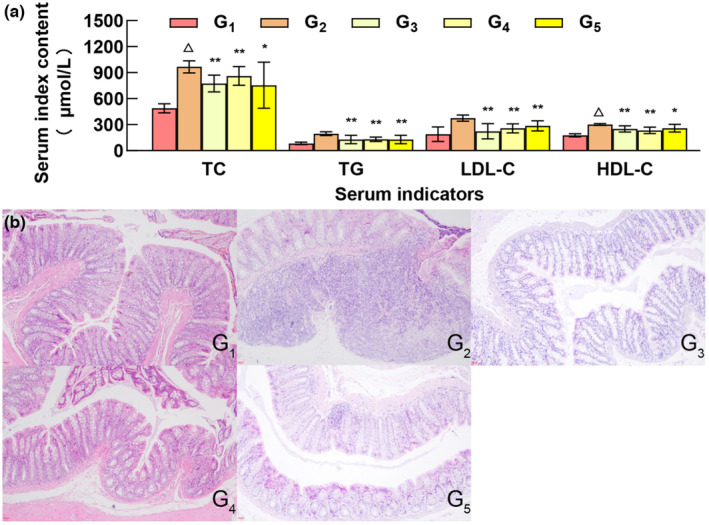
FIGURE 1.

Effects of different doses of MOC on blood lipid and colon morphology in rats. G1, G2, G3, G4, and G5 represent the control group, model group, MOC low‐dose group, MOC medium‐dose group, and MOC high‐dose group, respectively. Compared with model group, **p < .01, *p < .05; Compared with blank group, △p < .01.
