
Figure 2. FAM120A is required for the expression of lipogenic enzymes.
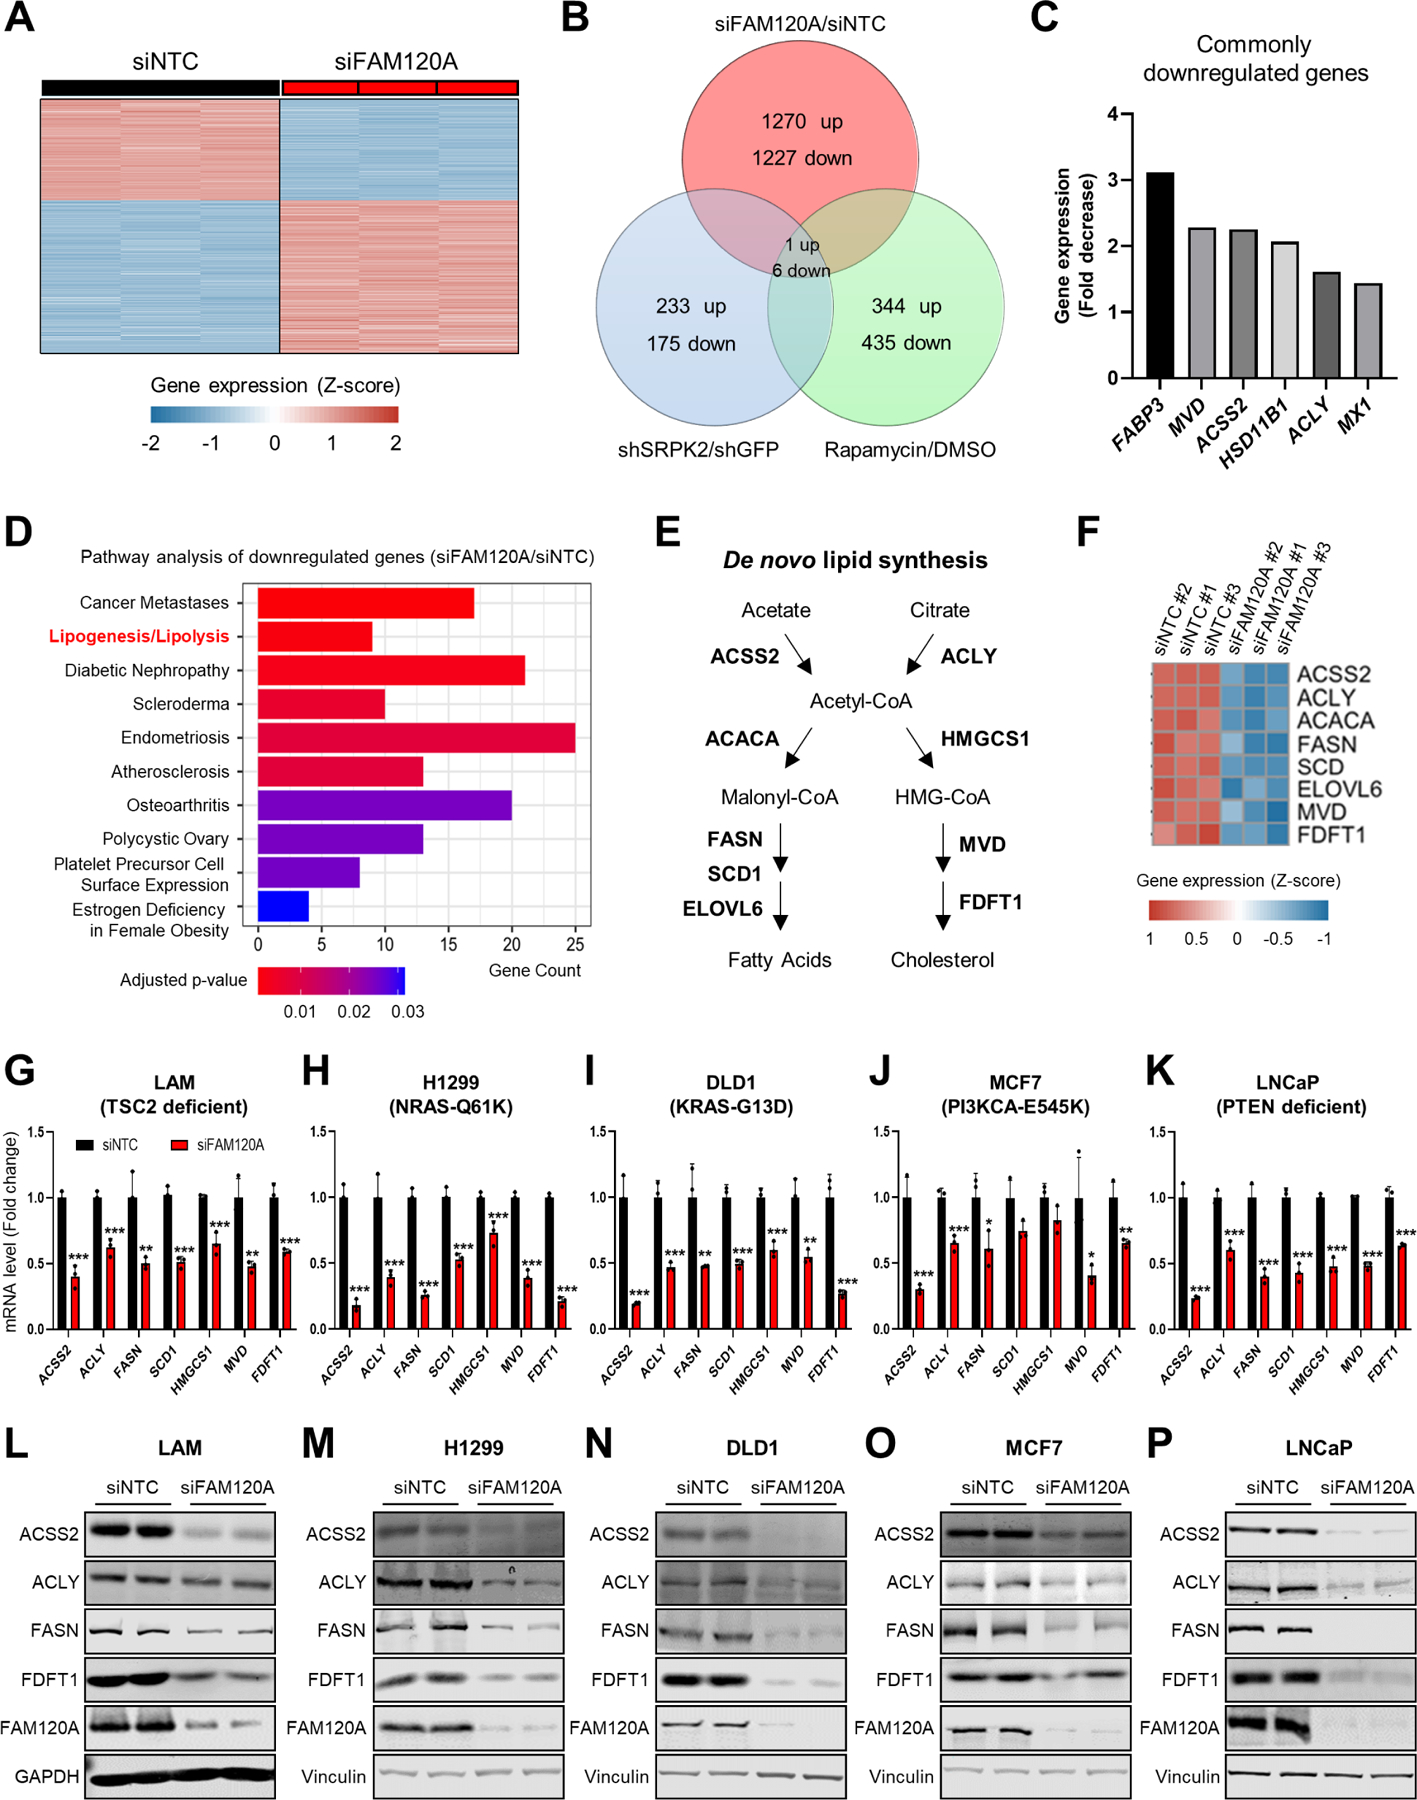
(A) Heatmap of z-scores for differentially expressed gene levels (cutoff: |Log2(Fold Change or FC)| ≥ 1, q-value < 0.005) in LAM 621–101 cells (hereinafter referred to as LAM cells) transfected with siRNAs targeting FAM120A or non-targeting control (NTC, hereinafter referred to as control) (GSE207172). N = 3. Same RNA-seq results are used in (A-F).
(B) Venn diagram analysis of the differentially regulated genes (cutoff: Linear fold change ≥ 1.5) identified from the whole-transcriptome microarray and RNA-seq analyses in LAM cells. The gene expression analyses were conducted on cells treated with rapamycin (20 nM) or vehicle for 24 hr, on cells stably expressing shRNAs targeting SRPK2 or GFP (GSE104335)12, or on cells transfected with siRNAs targeting FAM120A or control (GSE207172).
(C) Fold decrease of 6 commonly downregulated genes from the Venn diagram analysis in (B). Fold decrease values from siNTC vs. siFAM120A RNAseq analysis are shown.
(D) Pathway analysis of downregulated genes by FAM120A knockdown.
(E) Schematic of de novo lipogenesis.
(F) Heatmap of z-scores for the lipogenic gene levels decreased by FAM120A knockdown.
(G-K) QPCR analysis of LAM (G), H1299 (H), DLD1 (I), MCF7 (J), and LNCaP (K) cells transfected with siRNAs targeting FAM120A or control and serum starved overnight. N = 3. Data are represented as mean ± SD. *p < 0.05, **p < 0.01, and ***p < 0.001.
(L-P) Immunoblot analysis of LAM (L), H1299 (M), DLD1 (N), MCF7 (O), and LNCaP (P) cells transfected with siRNAs targeting FAM120A or control and serum-starved overnight.
See also Supplemental Figure S1.