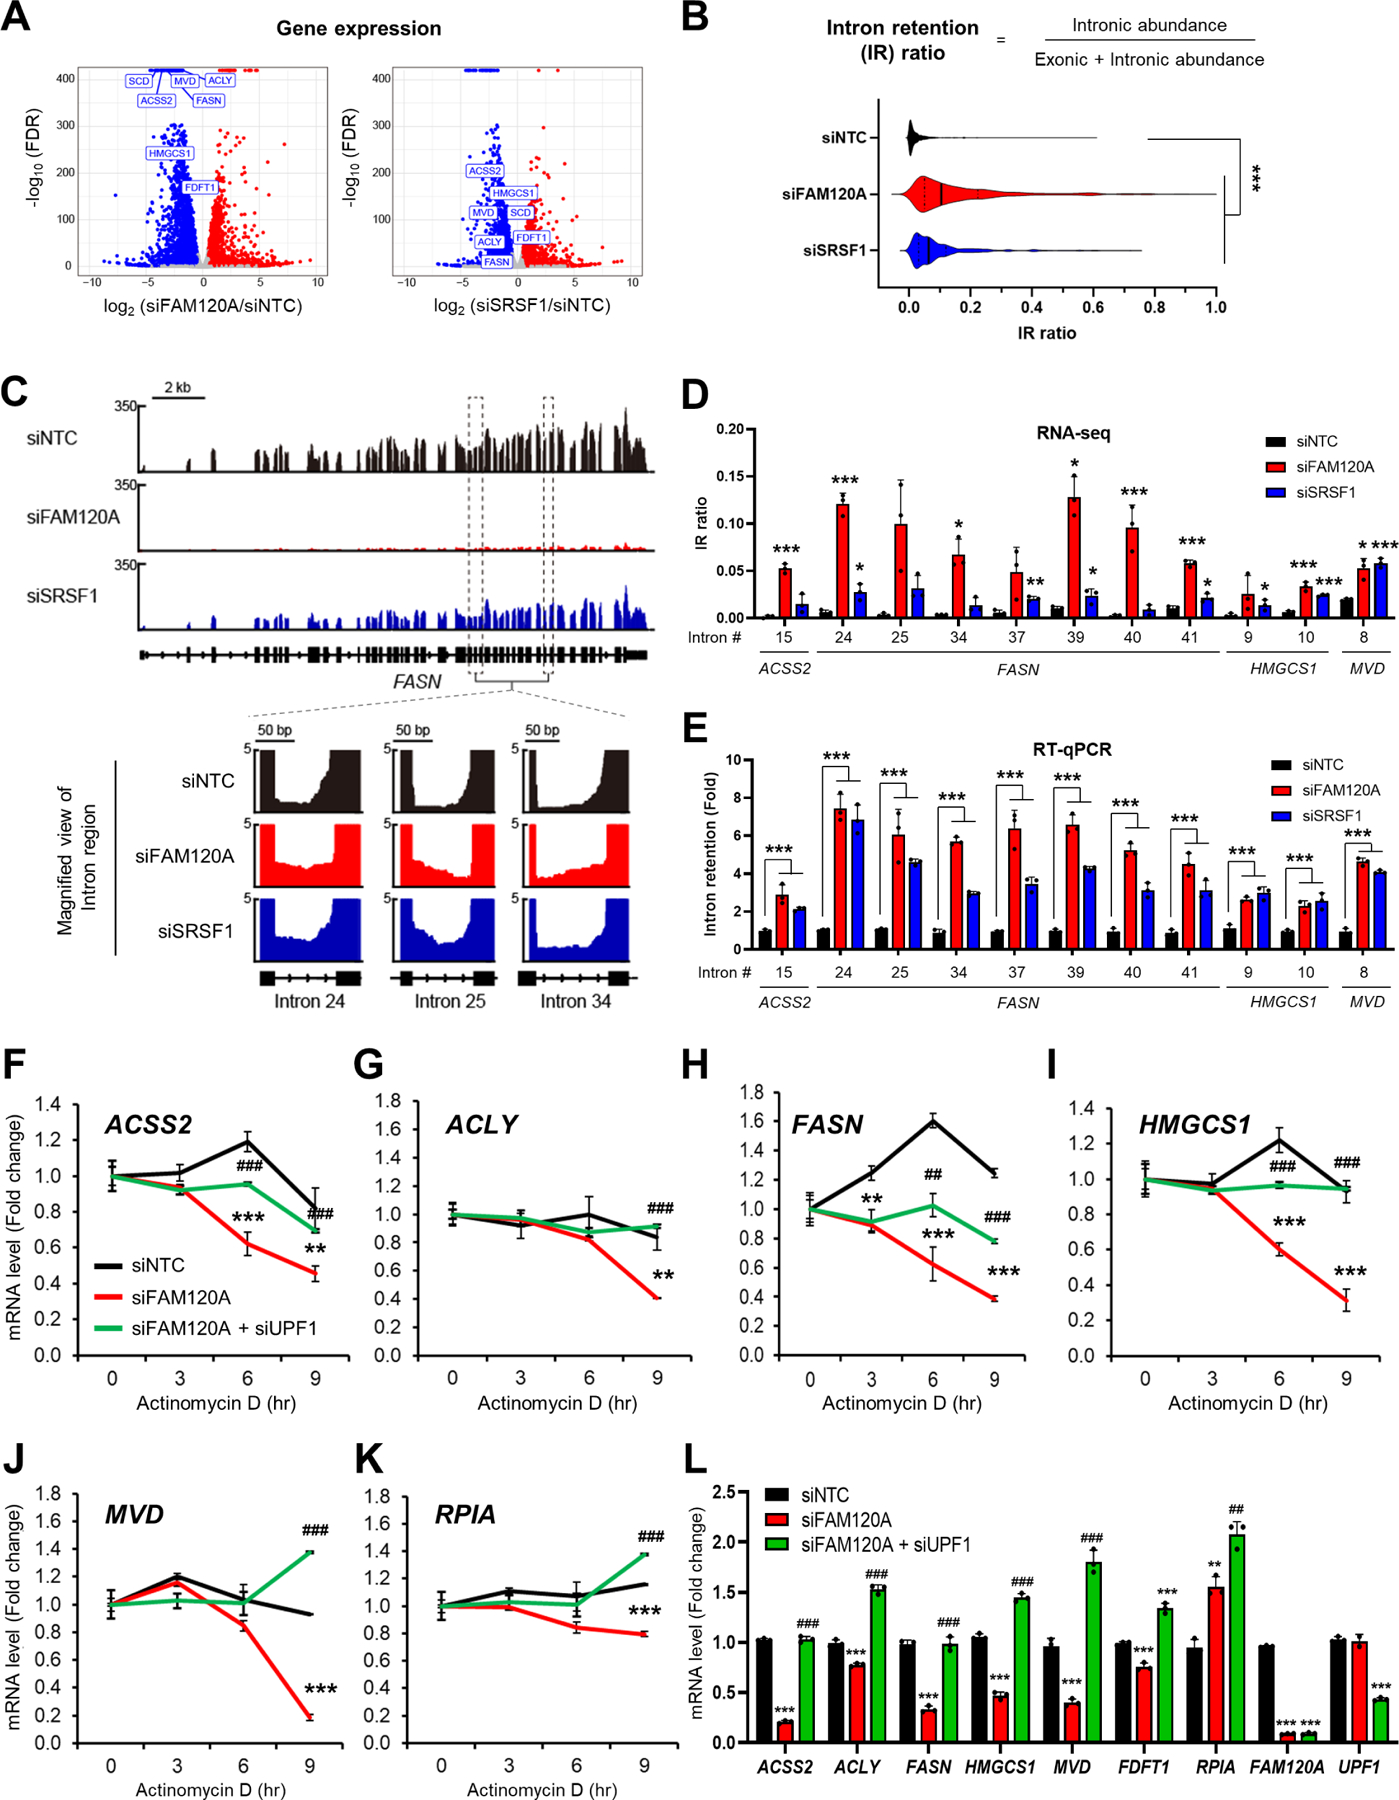
Figure 3. FAM120A is required for the splicing and stability of lipogenic genes.

(A) Volcano plot of gene expression from RNA-seq results in LAM cells transfected with siRNAs targeting FAM120A, SRSF1 or control with overnight serum starvation (GSE229657). Lipogenic genes are highlighted in rectangles. N = 3. Same RNA-seq results are used in (A-D).
(B) Violin plot of 408 intron loci that show significant intron retention (IR) in siFAM120A and siSRSF1 compared to control.
(C) (Upper) Representative genome browser example of RNA-seq on FASN1 locus. (Lower) Zoom-in view of intron loci of FASN that are retained by FAM120A or SRSF1 knockdown.
(D) Individual IR ratio calculated from IRFinderS of lipogenic genes from RNA-seq data.
(E) Validation of intron retention by qPCR analysis of LAM cells transfected with siRNAs targeting FAM120A, SRSF1 or control. Intron retention = (Expression of intron-included region) / (Expression of intron-excluded region).
(F-L) QPCR analysis of LAM cells transfected with siRNAs targeting FAM120A, UPF1, or control, and serum starved overnight. Actinomycin D (Act D, 5 μg/mL) was treated for the indicated time points for mRNA stability analysis (F-K). N = 3. p-value (*) was calculated between siNTC and siFAM120A. p-value (#) was calculated between siFAM120A and siFAM120A+siUPF1. Data are represented as mean ± SD. *p < 0.05, **p < 0.01, ***p < 0.001, ##p < 0.01, and ###p < 0.001.
See also Supplemental Figure S2 and Supplemental Table S1.
