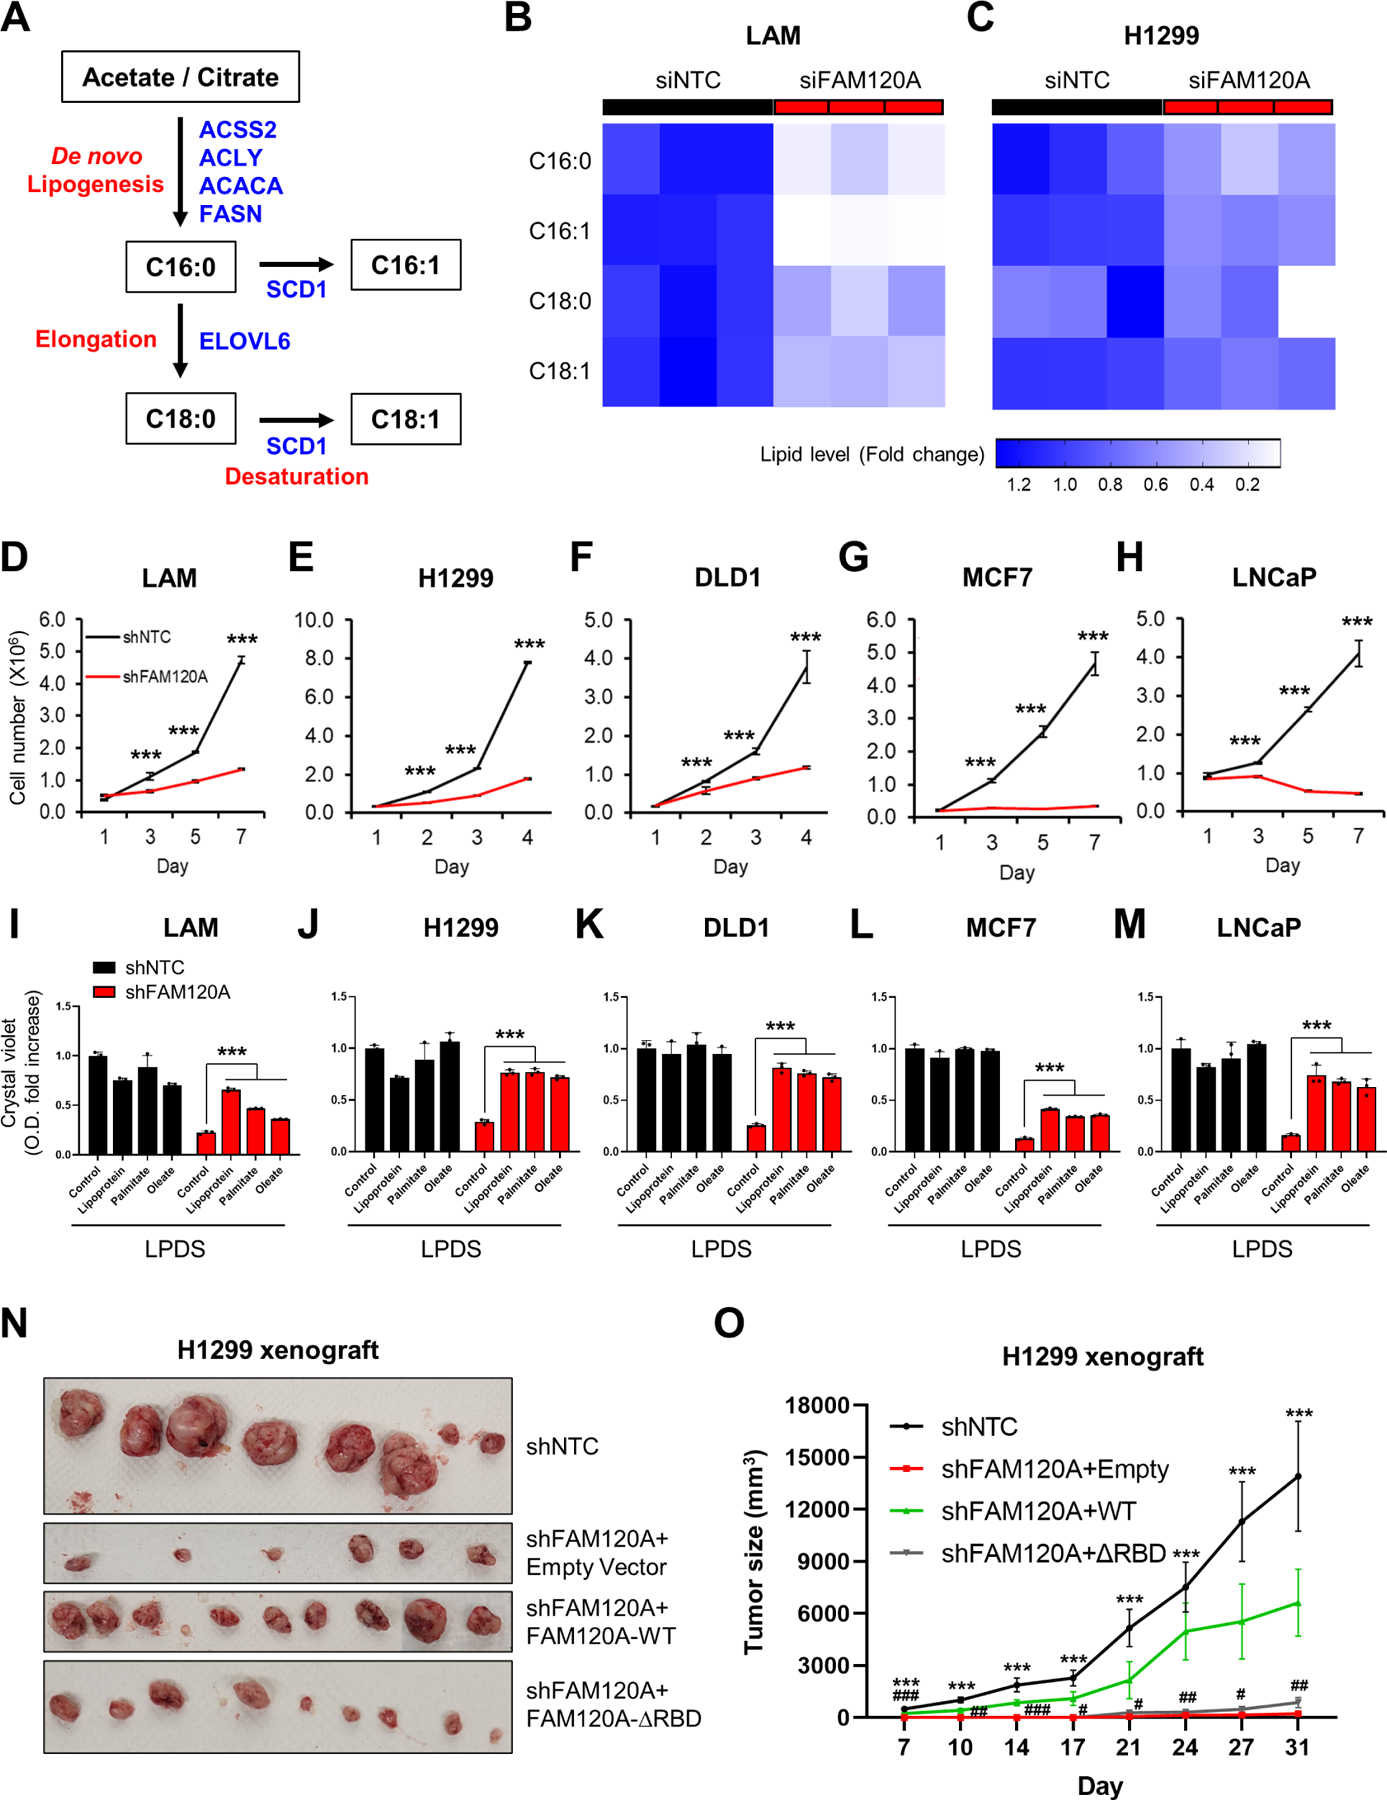
Figure 7. FAM120A RNA binding is essential for lipogenesis and tumor growth.

(A) Schematic of de novo fatty acid synthesis pathway.
(B, C) Heatmap of fatty acid levels. LC-MS analysis was performed on LAM cells transfected with siRNAs targeting FAM120A or control (B) and H1299 cells stably expressing shRNAs targeting FAM120A or control (C) with overnight serum starvation. N = 3.
(D-H) Cell proliferation analysis of LAM (D), H1299 (E), DLD1 (F), MCF7 (G), and LNCaP (H) cells stably expressing shRNAs targeting FAM120A or control. N = 3. Data are represented as mean ± SD.
(I-M) Crystal violet (CV) analysis of LAM (I), H1299 (J), DLD1 (K), MCF7 (L), and LNCaP (M) cells stably expressing shRNAs targeting FAM120A or control. Cells were grown in lipoprotein-deficient serum (LPDS)-containing media supplemented with lipoprotein (25 μg/ml), palmitate-albumin (10 μM, palmitate), oleate-albumin (50 μM, oleate), or fatty acid-free albumin (25 μM, control). The graph shows the quantified absorbance of solubilized CV stain. N = 3. Data are represented as mean ± SD.
(N-O) Xenograft tumor growth assay of H1299 cells stably expressing shNTC or shFAM120A with FAM120A WT or ∆RBD. N ≥ 4. Data are represented as mean ± SEM. p-value (*) was calculated between shNTC and shFAM120A+Empty. p-value (#) was calculated between shFAM120A+Empty and shFAM120A+WT. Data are represented as mean ± SD. ***p < 0.001, #p < 0.05, ##p < 0.01, and ###p < 0.001.
See also Supplemental Figure S7.
