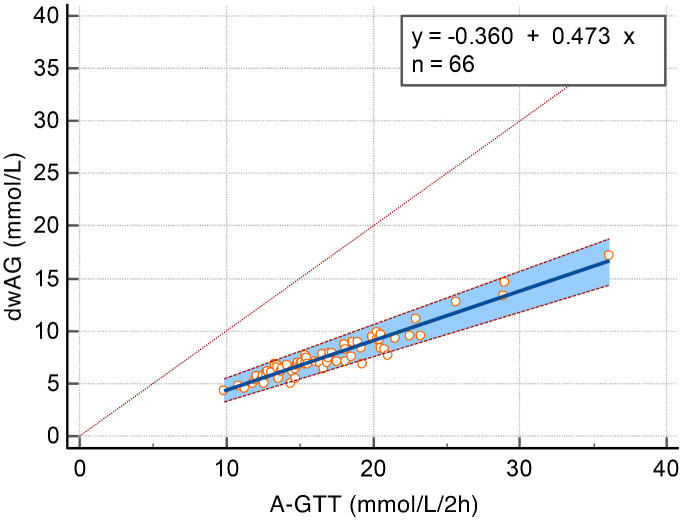
Figure 1.
Passing–Bablok regression plot showing data and fit for dwAG measure of glucose excursion predicted from A-GTT. Cusum test for linearity, no significant deviation from linearity (P ═ 0.83); Spearman rank correlation coefficient 0.934 (95% CI 0.894–0.959). A-GTT: Area under the glucose tolerance test; dwAG: Doi’s weighted average glucose.

