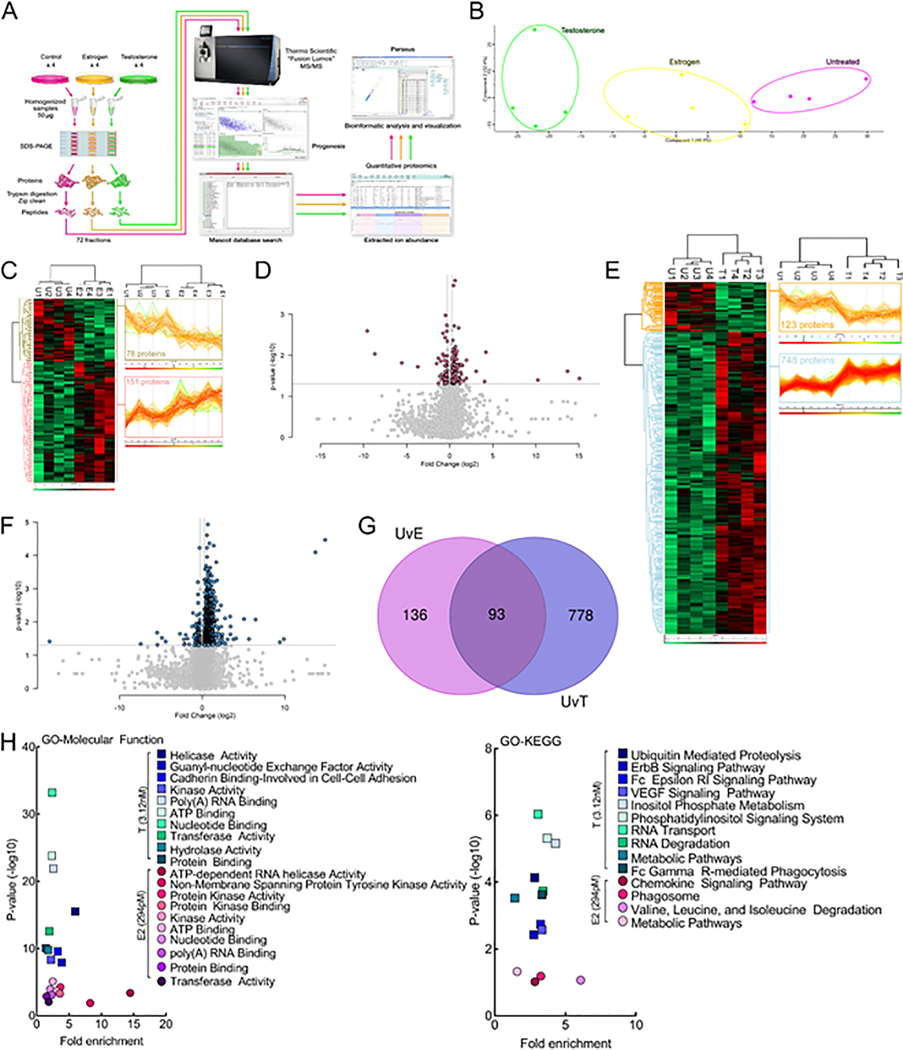
Fig. 6.
Proteomic analysis of bEnd.3 endothelial cells reveals differences in hormone-regulated molecular function and KEGG pathways.17-β-Estradiol and testosterone differentially regulate the protein expression levels of bEnd.3 endothelial cells in vitro. (A) Schematic diagram of the label-free quantitative proteomics experimental approach (n = 4). bEnd.3 endothelial cells were treated and lysed as described in Materials & Methods. 200 μg of lysate was separated by 10% SDS-PAGE and each gel lane was fractionated into six gel slices that were subjected to trypsin digestion. The resulting tryptic digest was purified and subsequently analyzed by tandem mass spectrometry. Raw data processing for quantification was executed in Progenesis QI for Proteomics and peptide/protein identification was performed by database searching with Mascot. The resulting Mascot peptide and protein identifications were imported into Progenesis QI for Proteomics and quantification of changes in peptide/protein abundance was performed via extracted ion abundance in Progenesis QI for Proteomics. The resulting quantitative proteomics data was further processed by Perseus for visual representation of the findings. MS/MS, tandem mass spectrometry. (B) Unbiased principal component analysis (PCA) of the 805 significantly affected proteins from the 3-way ANOVA analysis of the quantitative proteomics data revealed that the protein expression differences of the individual biological samples within each group were consistent and no outliers were detected and also indicated that testosterone had a more significant effect on protein expression versus estrogen (relative to the untreated control). (C) Unbiased hierarchical clustering of the 229 significantly affected proteins in the estrogen versus untreated control treatment groups confirmed that the expression patterns across the different individual biological samples cluster together accordingly as either untreated control or estrogen. A heat map and linked dendrogram of the hierarchical clustering results provide a visual representation of the clustered matrix and the associated profile plots further reveal consistency within groups of the corresponding protein expression patterns (see the two boxes to the right of the heat map). (D) A volcano plot of the estrogen versus untreated control. Above the horizontal grey line represents the cut-off for a p value of <0.5 while the two vertical lines represent the cut-off values of 1.2-fold change in either the positive or negative direction. (E) Unbiased hierarchical clustering of the 871 significantly affected proteins in the testosterone versus untreated control treatment groups confirmed that the expression patterns across the different individual biological samples cluster together accordingly as either untreated control or testosterone. A heat map and linked dendrogram of the hierarchical clustering results provide a visual representation of the clustered matrix and the associated profile plots further reveal consistency within groups of the corresponding protein expression patterns (see the two boxes to the right of the heat map). (F) A volcano plot of the testosterone versus untreated control. Above the horizontal grey line represents the cut-off for a p value of <0.5 while the two vertical lines represent the cut-off values of 1.2-fold change in either the positive or negative direction. (G) A Venn diagram of the significantly affected proteins in the untreated control versus estrogen (UvE) experiment compared to the untreated control versus testosterone (UvT) experiment. (H) Scatter plots of the “Molecular Function” and “KEGG pathways” gene ontology enrichment findings for both the untreated control versus estrogen and untreated control versus testosterone experiments. GO, gene ontology. N = 4/treatment.

