
Fig. 2.
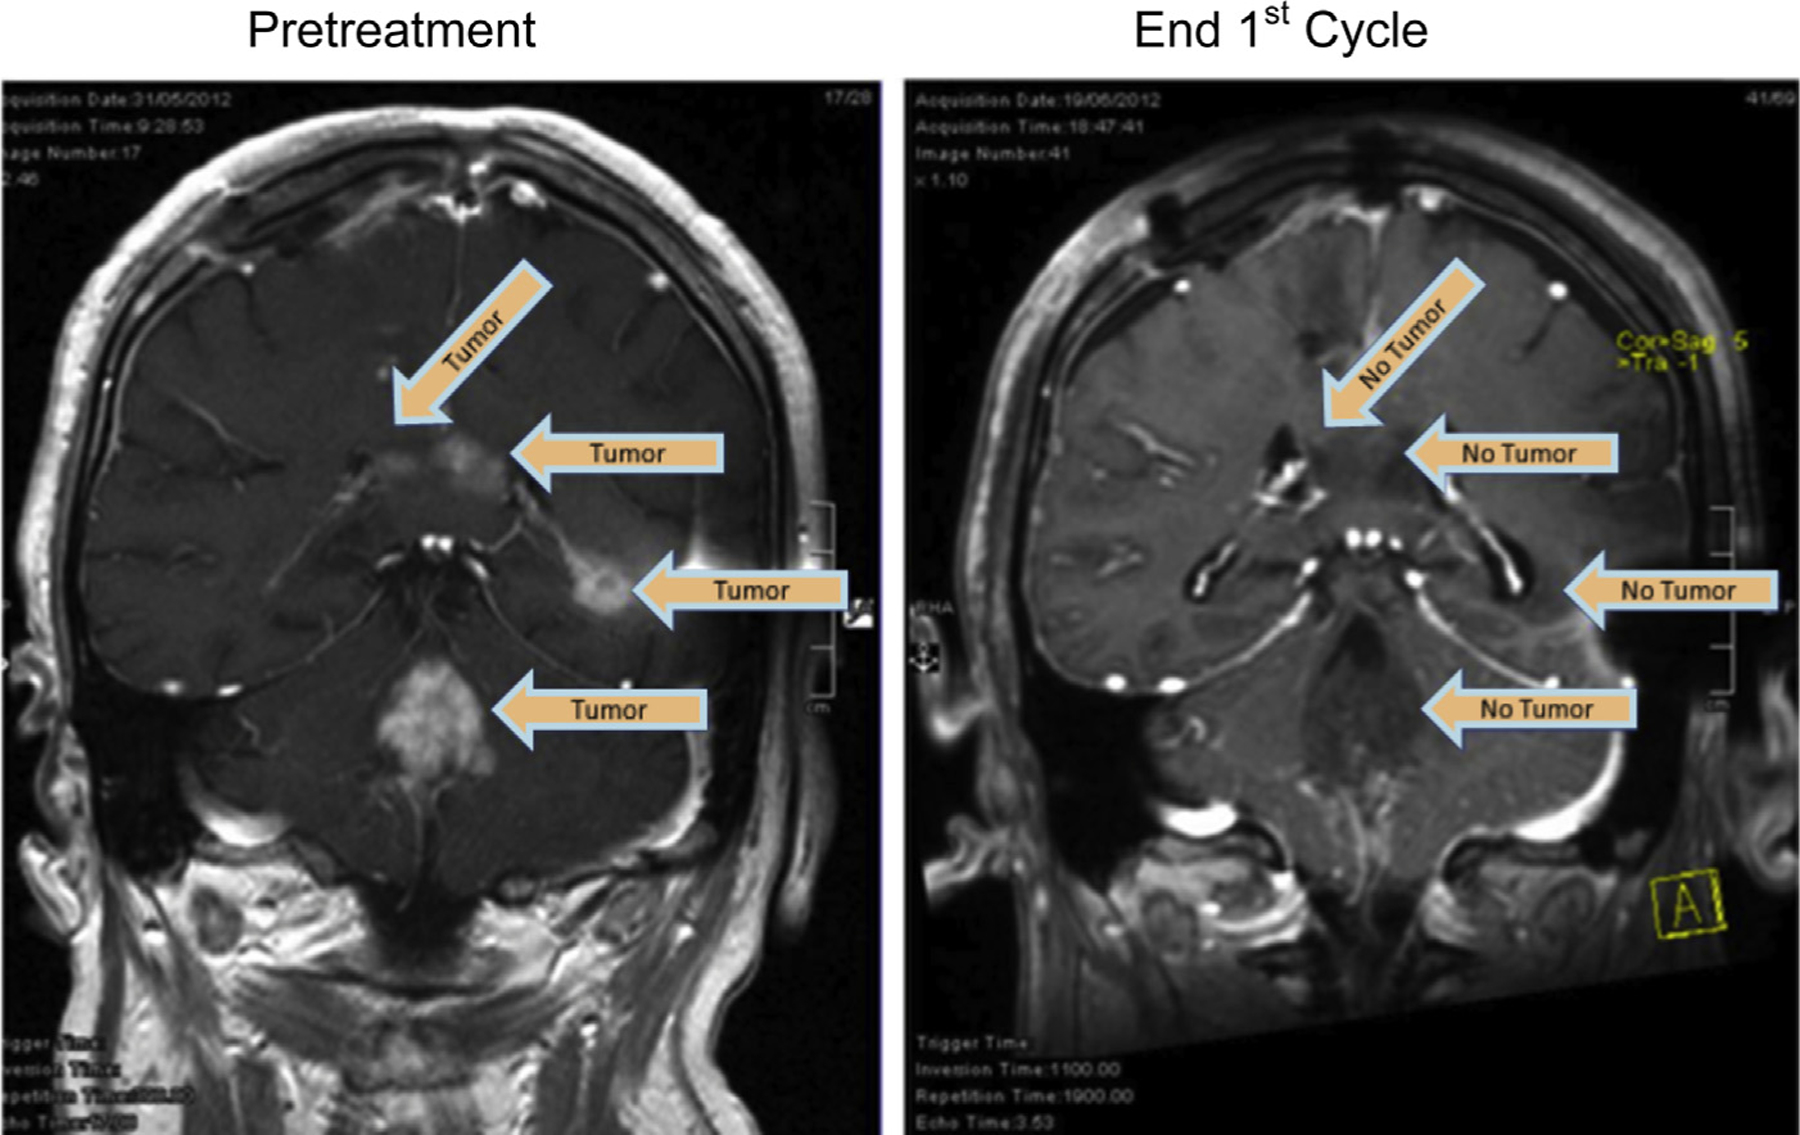
MRI scans of a patient made on 31 May 2012 (left, pretreatment), versus June 19, 2012 (right) following one treatment cycle (MRI scan, coronal view; end 1st cycle). Arrows indicate the locations of tumor tissue contrast staining.
Official websites use .gov
A
.gov website belongs to an official
government organization in the United States.
Secure .gov websites use HTTPS
A lock (
) or https:// means you've safely
connected to the .gov website. Share sensitive
information only on official, secure websites.
MRI scans of a patient made on 31 May 2012 (left, pretreatment), versus June 19, 2012 (right) following one treatment cycle (MRI scan, coronal view; end 1st cycle). Arrows indicate the locations of tumor tissue contrast staining.