
FIG. 5.
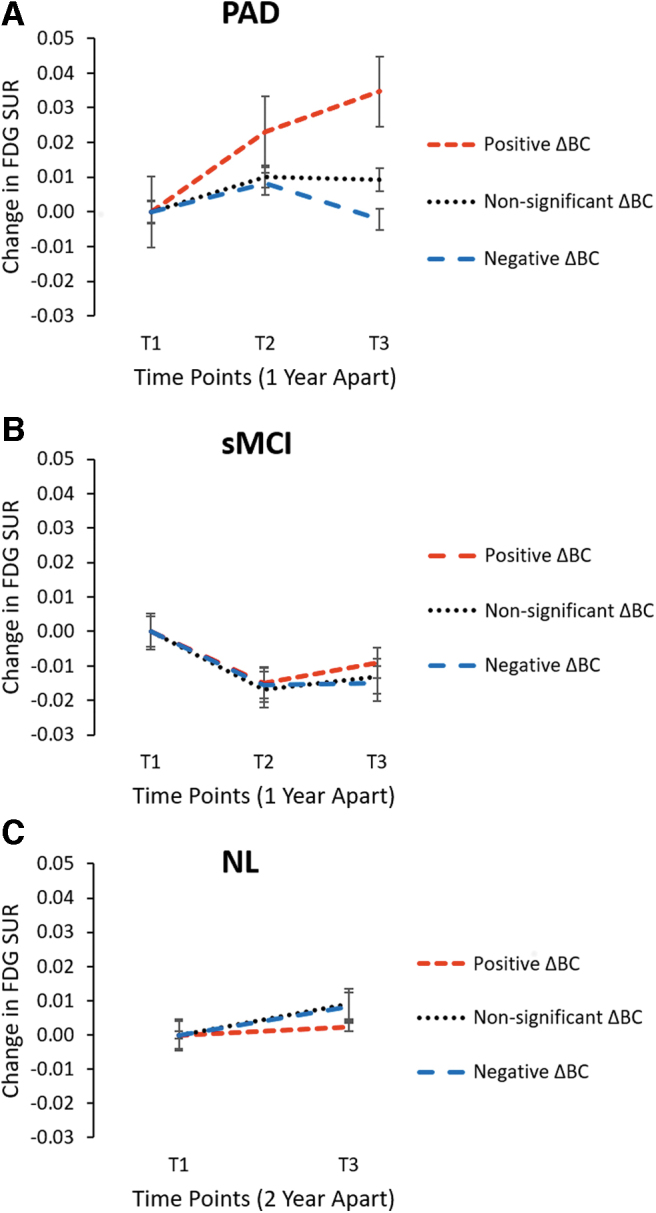
Longitudinal changes in FDG-SUR. The overall averaged changes in FDG-SUR in the high ΔBC regions (shown by dotted red line), NS ΔBC regions (shown by dotted black line), and low ΔBC regions (shown by dotted blue line). The high, NS, and low ΔBC regions were determined based on BC differences between AD and NL1 shown in Figure 5 (ΔBC >2, −2 < ΔBC <2, ΔBC < −2, respectively). (A) In the PAD subjects, there is a significant difference in averaged FDG-SUR between three groups with a significant interaction effect of ROI group and time (F[4,152] = 10.962, p = 7.764E-08). The metabolism increases significantly in “hub” regions in PAD subjects near conversion to AD. (B) In the sMCI subjects, there is no significant difference in averaged FDG-SUR between three ROI groups (F[4,152] = 0.706, p = 0.589). (C) In the NL2 subjects, there is no significant interaction effect of ROI group and time (F[2,73] = 1.144, p = 0.324). ROI, region of interest; NS, non-significant.