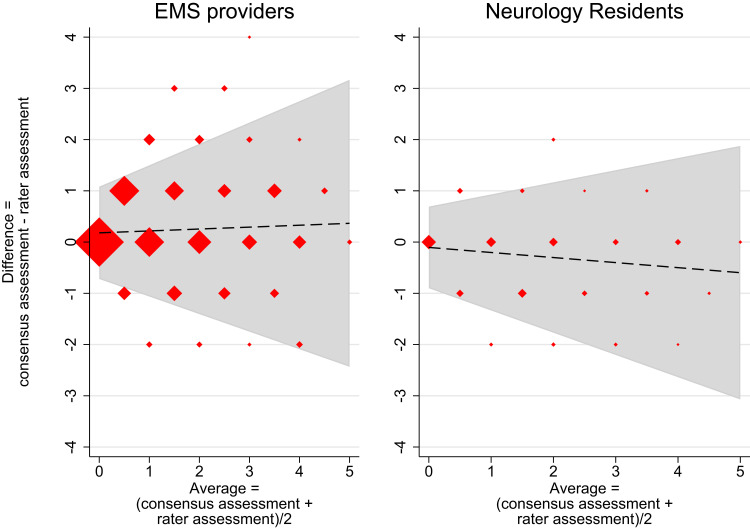
Figure 2.
Bland-Altman plots of EMS providers and neurology residents versus consensus assessment – without constrains on trend.
Notes: Bland Altman plot of the 1,800 total scores from the group of EMS providers (left) and the 240 total scores from the group of neurology residents (right) versus the corresponding consensus assessments. Dashed line = trendline of the mean difference between raters and the consensus, grey zone = limits of agreement (95%). Marker sizes represent the number of assessments. X-axis = average values of each rater assessment and the corresponding consensus assessment, Y-axis = deviation of rater score from the consensus assessment. The mean difference trendline is estimated using linear regression, while the limits of agreement are estimated using linear regression on the residuals of the trendline. Limits of agreement represent the 2.5 and 97.5 percentile observations centred at the mean difference and under the assumption of normal distributed residuals. Left: Mean difference trendline = 0.18 + 0.04 × average. Limits of agreement = mean difference ± 2.46 × (0.37 + 0.15 × average). 6.78% of the total scores are placed outside the limit of agreement. Right: Mean difference trendline = −0.10 + (−0.10 × average). Limits of agreement = mean difference ± 2.46 × (0.32 + 0.14 × average). 7.92% of the total scores are placed outside the limit of agreement.

