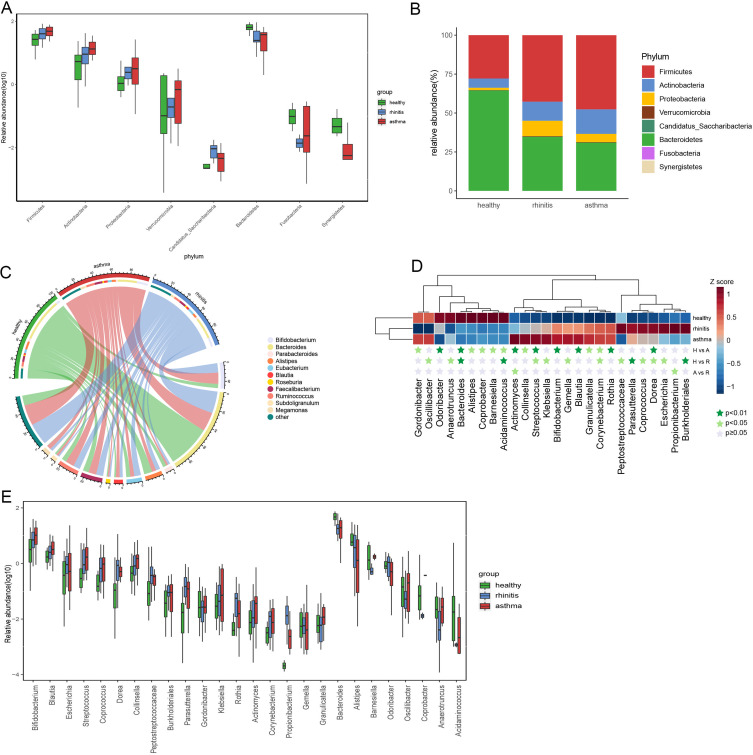
Figure 3.
Fecal microbial abundance at the major phylum level and major genera in the gut microbiome of patients with allergic rhinitis, allergic asthma, and healthy subjects. (A) Bacterial composition and relative abundance at the phylum level. (B) Differences at the phylum level. (C) Major genera of each group, less abundant (<1%), and unclassified taxa are grouped as “other” (D) The 26 different genus profiles of average relative abundance across three groups. The dark green star indicates P<0.01, the light green star indicates P<0.05, and the gray star indicates P≥0.05. (E) The relative abundance of 26 genera abundant in three groups was exhibited with a box plot.
Abbreviations: H, control; A, asthma; R, rhinitis.

