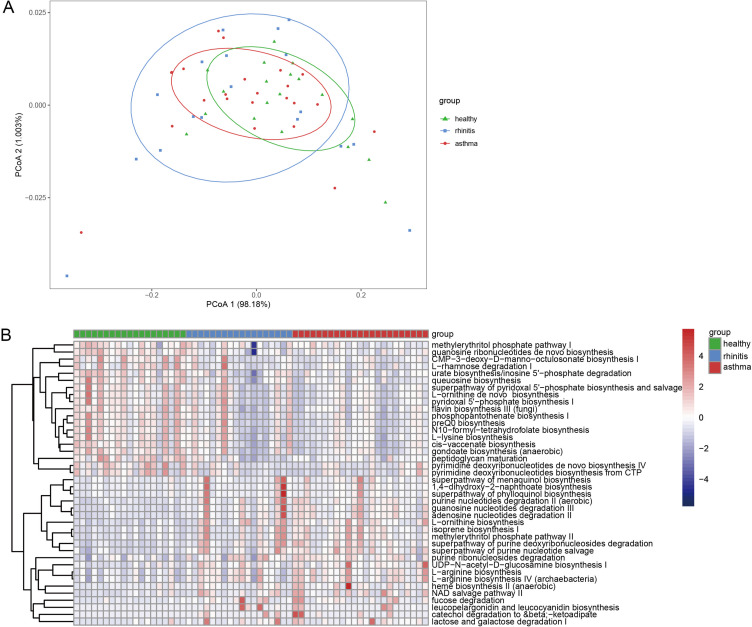
Figure 6.
Functional alterations in the gut microbiome. (A) The whole diversity in the pathways between different groups. (B) Differentially abundant functional gene pathway heatmap between allergic children and healthy controls; Colored by the relative abundance of each pathway. Identified by LEfSe at P<0.05 (Kruskal-Wallis test) and LDA score>2. P-values are adjusted by the false discovery rate (Benjamini-Hochberg FDR, q<0.05) method.

