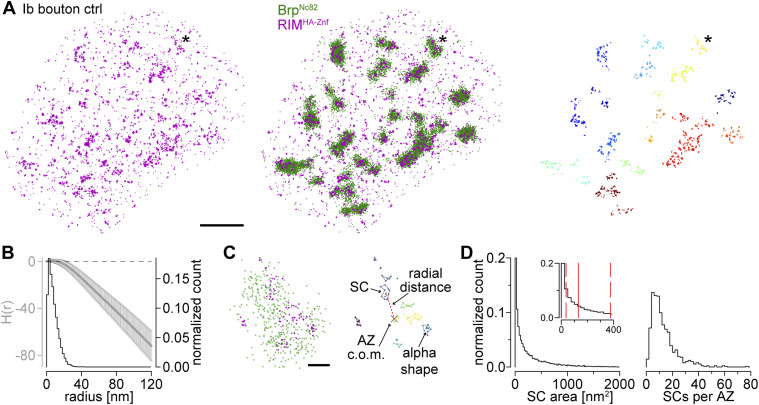
Figure 4. RIMHA−Znf clusters at presynaptic AZs.
(A) Two-channel dSTORM localizations for a rimHA−Znf type Ib bouton. Left: RIMHA−Znf stained with α-HA antibody and Alexa Fluor647 conjugated F(ab’)2 fragments (magenta). Middle: overlay with BrpNc82 labeled with Alexa Fluor 532-conjugated IgGs (green). (C) Asterisk marks enlarged AZ in (C). Right: RIMHA−Znf localizations from left panel with all localizations with Euclidian distance >20 nm to Brp localizations removed. The removed signal is considered noise. Individual RIMHA−Znf subclusters (SCs) were extracted by HDBSCAN and assigned to nearest AZs by color. (B) Averaged H function (gray, mean ± SD) from n = 542 RIMHA−Znf first-level clusters obtained from 18 NMJs and nine animals (maximum of the curve indicates a mean SC radius of 6 nm) and histogram (black) of the mean radius from n = 11,094 RIMHA−Znf SCs (estimated from SC area under the assumption of a circular area, median (25th–75th percentile): 6.4 (3.4–10.9) nm). Dashed black line indicates the prediction for a random Poisson distribution. (A, C) Enlarged plots of the AZ marked in (A). Left: two-channel dSTORM localizations of RIMHA−Znf and BrpNc82. Right: RIMHA−Znf SCs extracted by HDBSCAN in different colors. Colored lines indicate alpha shapes used for area determination. The center of mass (c.o.m.) of the corresponding AZ (x) is indicated. Dashed red line shows the Euclidian distance between the AZ c.o.m and an SC c.o.m., referred to as radial distance. Parameters in HDBSCAN were: minimum cluster size = 100 localizations, minimum samples = 25 localizations for BrpNc82; minimum cluster size = 2 localizations, minimum samples = 2 localizations for RIMHA−Znf; α-value BrpNc82 = 800 nm2, α-value RIMHA−Znf = 300 nm2; exclusion criteria for BrpNc82 clusters were area ≤ 0.03 μm2 and ≥ 0.3 μm2. (D) Distributions of RIMHA−Znf SC area (11,094 SCs from 18 NMJs in nine animals) and the number of RIMHA−Znf SCs per AZ (n = 893 AZs from 18 NMJs in nine animals) in all AZs without selection according to AZ circularity (see the Material and Methods section). Inset in the left panel highlights the range between 0 and 400 nm2 SC area. Solid red line indicates median, dashed red lines, 25th and 75th percentiles. Scale bars in (A) 1 μm, in (C) 100 nm.

