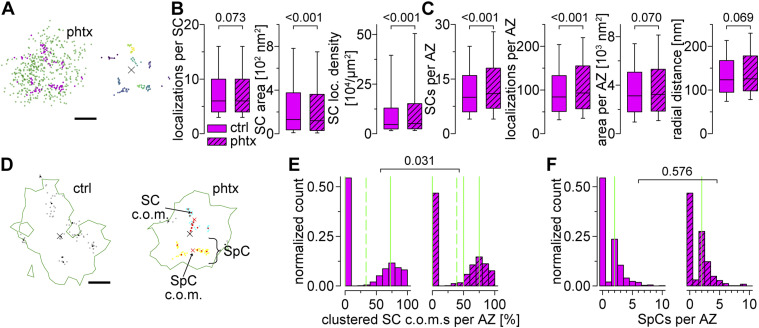
Figure 5. RIMHA−Znf subclusters are recruited to SpCs in acute PHP.
(A) Localizations of a type Ib AZ from a phtx larva. Left: two-channel dSTORM data of RIMHA−Znf (magenta) and BrpNc82 (green). Right: RIMHA−Znf SCs extracted by HDBSCAN in different colors. Colored lines indicate alpha shapes used for area determination. The AZ c.o.m. is indicated (x). (B) Number of localizations per RIMHA−Znf SC, SC area, and SC localization density in ctrl (filled boxes, n = 11,094 SCs from 18 NMJs in nine animals) and phtx (dashed boxes, n = 13,568 SCs from 19 NMJs in 12 animals) shown as box plots (horizontal lines show median, box boundaries show 25th and 75th percentiles, whiskers show 10th and 90th percentiles). (C) Number of RIMHA−Znf SCs per AZ, the total number of RIMHA−Znf localizations per AZ, the entire RIMHA−Znf area per AZ, and radial distance of RIMHA−Znf SCs per AZ in ctrl (n = 893 AZs from 18 NMJs in nine animals) and phtx (n = 963 AZs from 19 NMJs in 12 animals). (D) Representative, circular AZs (circularity ≥ 0.6) from a ctrl and a phtx type Ib bouton. Green lines indicate alpha shapes used for AZ area determination. Left: ctrl AZ from Fig 4C with gray dots indicating individual RIMHA−Znf localizations and black dots indicating SC c.o.m.s that do not belong to a supercluster (SpC). Right: two SpCs (shown in blue and yellow) were extracted by HDBSCAN from the c.o.m.s (red dots) of RIMHA−Znf SCs in the phtx AZ. Black dots represent SC c.o.m.s that are unclustered according to HDBSCAN analysis and gray dots show localizations of the corresponding SCs. Red x indicate c.o.m.s of SpCs. Dashed red line indicates the distance between a SC c.o.m. and the AZ c.o.m. (E) Percentage of SC c.o.m.s that are organized in SpCs per AZ for ctrl (n = 542 AZs from 18 NMJs in nine animals) and phtx (n = 545 AZs from 19 NMJs in 12 animals) shown as histograms. Dashed lines indicate mean, solid lines indicate median, 25th and 75th percentiles. Note that the 25th percentile and median fall together at zero in the left panel. (F) Number of SpCs per AZ. Median values, indicated in green, and statistical comparison refers to AZs with at least one SpC (ctrl: n = 247 AZs from 18 NMJs in nine animals; phtx: n = 290 AZs from 19 NMJs in 12 animals). Scale bars in (A) and (D) 100 nm.

