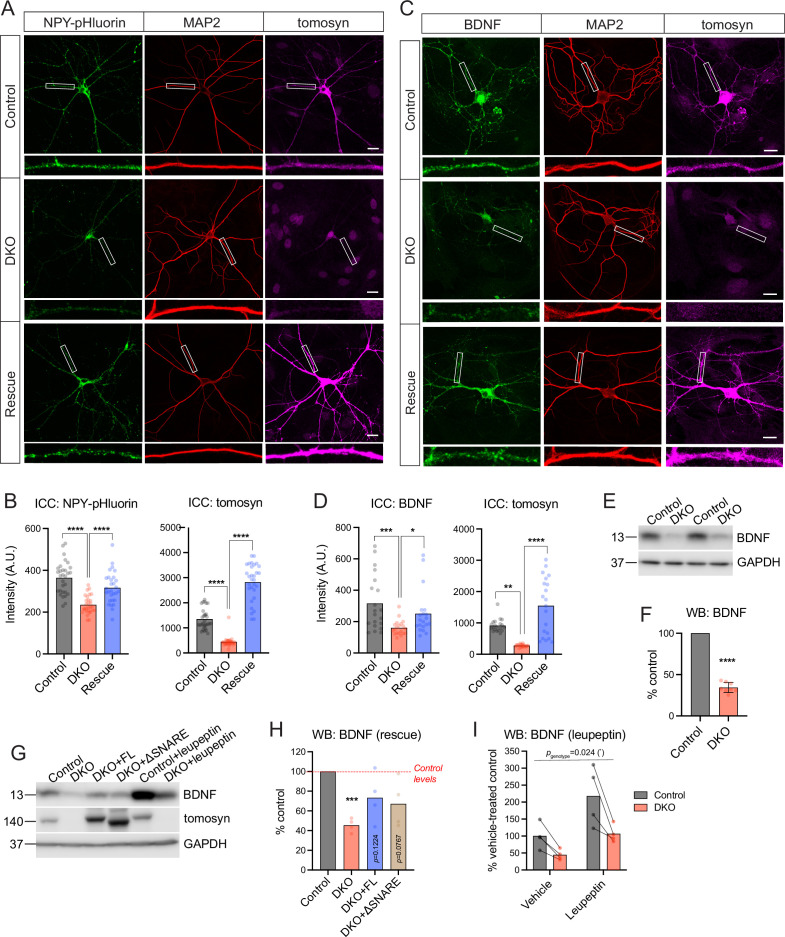
Figure 2. Tomosyns regulate the number and/or composition of neuronal dense core vesicles (DCVs).
(A) Representative images of the DCV reporter (NPY-pHluorin) in control, double knockout (DKO), and DKO re-expressing tomosyn (Stxbp5 isoform m, ‘Rescue’) neurons. Neurons were grown in mass cultures, silenced with sodium channel blocker tetrodotoxin (TTX, 1 µM) for 48 hr, and fixed on DIV14. White boxes indicate zoomed-in segments of neurites shown under every image. Scale bar 20 µm. (B) Mean intensity of NPY-pHluorin and tomosyn immunostaining in control, DKO, and rescued neurons exemplified in (A). Data were analyzed using one-way ANOVA with Tukey’s multiple comparisons post hoc test. n=29–30 neurons (plotted as dots)/ genotype. ****p<0.0001. (C) Representative images of BDNF immunostaining in control, DKO, and DKO re-expressing tomosyn neurons. Neurons were grown on glial microislands and fixed on DIV16. White boxes indicate zoomed-in segments of neurites shown under every image. Scale bar 20 µm. (D) Quantification of the mean BDNF and tomosyn intensity in control, DKO and rescued neurons exemplified in (C). Data were analyzed using the Kruskal-Wallis test with Dunn’s multiple comparisons post hoc test (BDNF) and one-way ANOVA with Tukey’s multiple comparisons post hoc test (tomosyn). n=20 neurons (plotted as dots)/ genotype. ****p<0.0001. (E) BDNF levels as detected by western blot (WB) in lysates of control and DKO neuronal cultures. Equal loading was verified by immunodetection of GAPDH. (F) Quantification of the BDNF band intensity from WB exemplified in (E). BDNF levels in DKO neurons were normalized to control levels in the corresponding culture. DKO data are plotted as mean ± SD and were analyzed using one-sample t-test. n=8 samples/genotype from four culture preparations. ****p<0.0001. (G) Re-expression of tomosyn (either full length, ‘FL,’ or a truncated mutant lacking the SNARE domain, ‘ΔSNARE’) partially restores BDNF levels in DKO neurons as detected by WB. Same WB shows that an inhibition of lysosomal proteolysis by leupeptin (50 μM for 24 hr) does not equalize BDNF levels between control and DKO neurons. Immunodetection of tomosyn was used to validate the expression and the correct size of the rescue constructs. Equal loading was verified by immunodetection of GAPDH. (H) Quantification of the BDNF band intensity from WB exemplified in (G). BDNF levels in DKO neurons are shown as the mean % of control levels. Data were analyzed using one-sample t-test comparing to 100% (control levels). n=4 samples/genotype from two culture preparations. ***p<0.001. (I) Quantification of the BDNF band intensity in leupeptin-treated samples from WB exemplified in (G). BDNF levels in all groups are shown as % of the averaged vehicle-treated control levels. Bars indicate mean values. Data were analyzed using a two-way repeated measures ANOVA. n=4 samples/genotype from two culture preparations.


