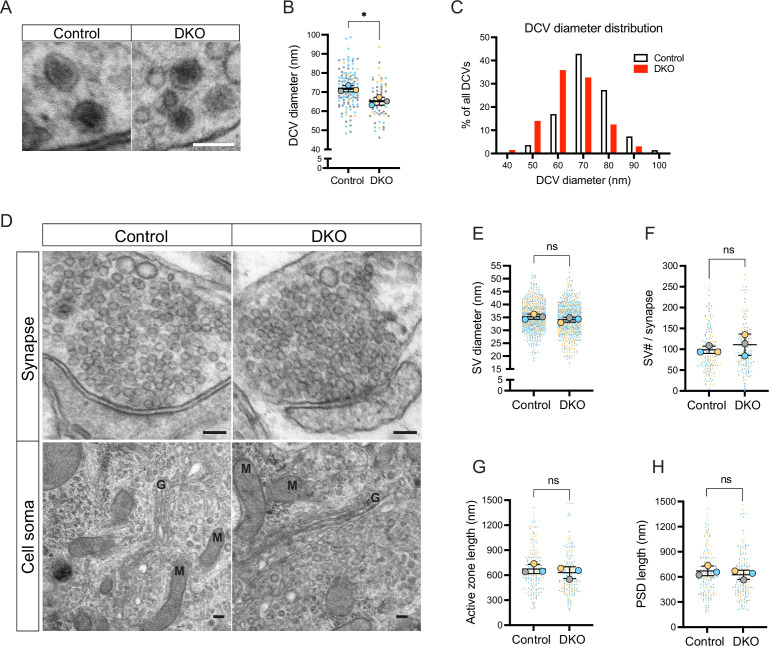
Figure 4. Loss of tomosyns results in a decrease of dense core vesicle (DCV) but not of synaptic vesicle (SV) size.
(A) Example EM images show the normal appearance of DCVs with a typical dense core in double knockout (DKO) neurons. Scale bar 100 nm. (B) DCV diameter is reduced in DKO neurons, as quantified from EM images exemplified in (A). Data are shown as a SuperPlot, where averages from three independent cultures (biological replicates) are shown as large circles and single observations (DCV profiles) as dots. Data from each culture are shown in a different color. Horizontal bars represent the means of the averages from the three cultures, which were compared using a two-tailed unpaired t-test. Error bars are SD. Number of DCV profiles analyzed: 135 (control) and 64 (DKO). *p<0.05. (C) Frequency distribution of DCVs by diameter is skewed to the left in DKO neurons, indicating a higher proportion of smaller DCVs in DKO neurons than in control. (D) Example EM images show normal ultrastructure of synapses and other cellular organelles in DKO neurons. Golgi cisternae and selected mitochondria are labeled with 'G' and 'M,' respectively. Scale bar 100 nm. (E–H) Quantification of SV diameter, SV number per synapse, length of the active zone, and length of postsynaptic density (PSD) from EM images exemplified in (D). Data are shown as SuperPlots and analyzed as described in (B). Number of individual observations: 617–621 SV profiles (E) and 148–152 synapses (F–H). ns: not significant.

