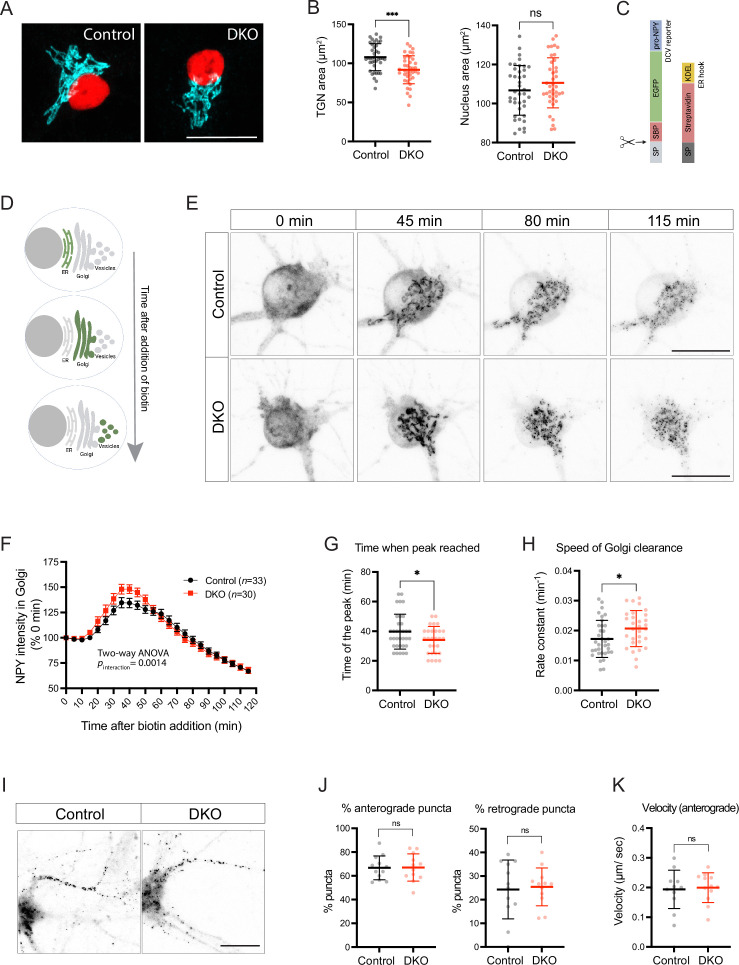
Figure 5. Loss of tomosyns results in the accelerated trafficking of a dense core vesicle (DCV) cargo through Golgi.
(A) Trans-Golgi network (TGN) area is decreased in double knockout (DKO) neurons. Representative images of immunostained TGN marker, TMEM87A (shown in cyan). Nuclei are labeled in red due to the expression of mCherry-tagged Cre or ΔCre. Scale bar 20 µm. (B) Quantification of the area of the TGN and nuclei from confocal microscopy images exemplified in (A). Data are shown as mean ± SD and were analyzed using a two-tailed unpaired t-test. n=39–40 neurons/ genotype. ***p<0.001; ns: not significant. (C) Design of the construct for the Retention Using Selective Hooks (RUSH) assay. As a DCV cargo, human pre-pro-NPY fused to streptavidin-binding peptide (SBP) and enhanced green fluorescent protein (EGFP) was used. The cargo was immobilized at the endoplasmic reticulum (ER) due to interaction with the ER hook, consisting of streptavidin fused to the ER-retention/retrieval signal KDEL. (D) Scheme illustrating synchronized trafficking of a DCV cargo through the secretory pathway upon the addition of biotin in the RUSH assay. (E) Snapshots of time-lapse videos taken after the addition of biotin in the RUSH assay. Time passed after the addition of biotin is shown on top. DCV cargo passes through the Golgi in roughly 45 min after the addition of biotin and gets concentrated in fine puncta that eventually leave cell soma. Scale bar 20 µm. (F) NPY-EGFP intensity in the Golgi area plotted against time after the addition of biotin. Intensity values were normalized to the basal levels (before the addition of biotin). Data are shown as mean ± SEM and were analyzed by two-way ANOVA. n=30–34 neurons/genotype. (G) Time required to reach maximum NPY-EGFP intensity at the Golgi, quantified from (F), is reduced in DKO. Data are shown as mean ± SD and were analyzed by a two-tailed unpaired t-test. *p<0.05. (H) Speed of NPY-EGFP export from the Golgi is increased in DKO neurons. Rate constants were calculated from first-order decay curves fitted to the data shown in (F). Data are shown as mean ± SD and were analyzed by a two-tailed unpaired t-test. *p<0.05. (I) Snapshots of time-lapse videos taken 90 min after the addition of biotin in the RUSH assay with the focus on neurites, where newly made DCVs trafficked after exit from the Golgi. (J) Proportion of newly made DCVs trafficking in anterograde and retrograde directions as quantified from the time-lapse videos exemplified in (I). Majority of vesicles are trafficked anterogradely in neurons of both genotypes. Data are shown as mean ± SD and were analyzed by a two-tailed unpaired t-test. n=12 neurons/genotype. ns: not significant. (K) Speed of anterogradely trafficking vesicles as quantified from the time-lapse videos exemplified in (I). Data are shown as mean ± SD and were analyzed by a two-tailed unpaired t-test. n=12 neurons/genotype. ns: not significant.
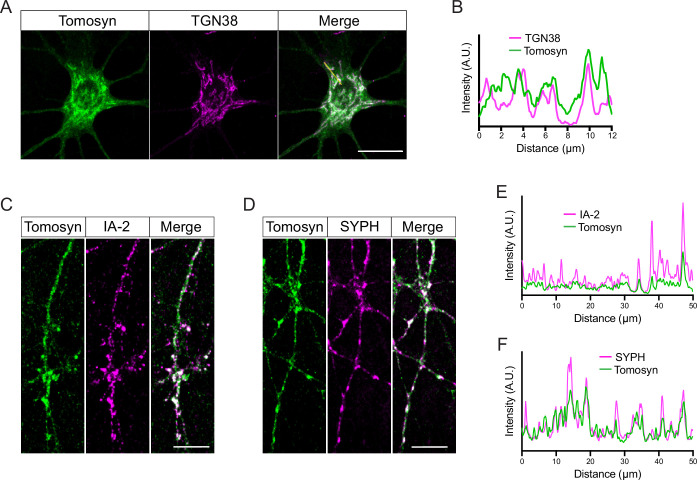
Figure 5—figure supplement 1. Localization of tomosyn to the trans-Golgi network (TGN), dense core vesicles (DCVs), and synapses.
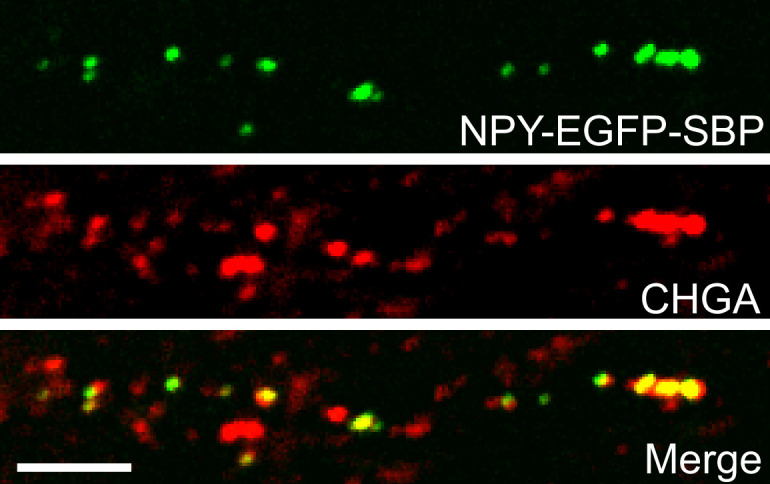
Figure 5—figure supplement 2. Retention Using Selective Hooks (RUSH)-generated vesicles contain endogenous dense core vesicle (DCV) marker, chromogranins (CHGA).


