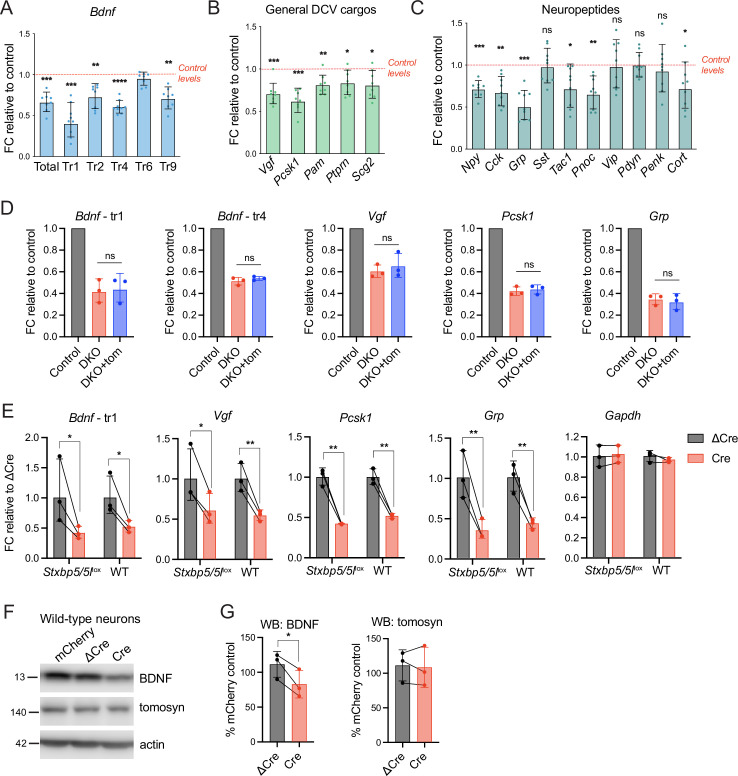
Figure 6. Decreased mRNA expression of some dense core vesicle (DCV) cargos in double knockout (DKO) is caused by Cre recombinase expression and not by the loss of tomosyns.
(A) mRNA levels of different Bdnf transcript isoforms as assessed by quantitative RT-PCR and normalized to Gapdh. Data are shown as fold changes (FC) relative to control levels in the corresponding culture preparation. n=8 culture preparations/genotype. Dots represent individual cultures, bar graphs are geometric means, and error bars are geometric SD. Log2FC (ΔΔCt) were analyzed by one-sample t-test. **p<0.01; ***p<0.001; ****p<0.0001. (B) mRNA levels of general DCV cargos as assessed by quantitative RT-PCR and normalized to Gapdh. Data are shown and analyzed as described in (A). *p<0.05; **p<0.01; ***p<0.001. (C) mRNA levels of most abundant hippocampal neuropeptides as assessed by quantitative RT-PCR and normalized to Gapdh. Neuropeptides are sorted by their abundance in hippocampal neurons. Data are shown and analyzed as described in (A). *p<0.05; **p<0.01; ***p<0.001, ns: not significant. (D) Re-expression of tomosyn does not restore mRNA expression of DCV cargos in DKO neurons. mRNA levels of Bdnf, Vgf, Pcsk1, and Grp were normalized to Gapdh and plotted as described in (A). Comparison between DKO and DKO re-expressing tomosyn (DKO +tom) is performed using a two-tailed paired t-test on Log2FC (ΔΔCt). n=3 culture preparations/ genotype. ns: not significant. (E) Expression of Cre-recombinase in wild-type (WT) neurons results in the decreased mRNA expression of DCV cargos. Effects of Cre on Stxbp5/5llox neurons are shown for the direct comparison. mRNA levels of the DCV cargos were normalized to Gapdh and plotted as fold changes (FC) relative to ΔCre. Comparisons between ΔCre and Cre conditions in each genotype were performed using a two-tailed paired t-test. n=8 culture preparations/genotype. *p<0.05; **p<0.01. (F) brain-derived neurotrophic factor (BDNF) and tomosyn levels as detected by western blot (WB) in lysates of ΔCre-mCherry and Cre-mCherry-expressing wild-type neurons. mCherry expression was used as a control. Equal loading was verified by immunodetection of GAPDH. (G) Quantification of BDNF and tomosyn bands intensity from WB exemplified in (F). BDNF and tomosyn levels in (Δ)Cre-expressing wild-type neurons are shown as mean % of control (mCherry-expressing neurons). Error bars represent SD. Data were analyzed using a two-tailed paired t-test. n=3 samples/ genotype. *p<0.05.
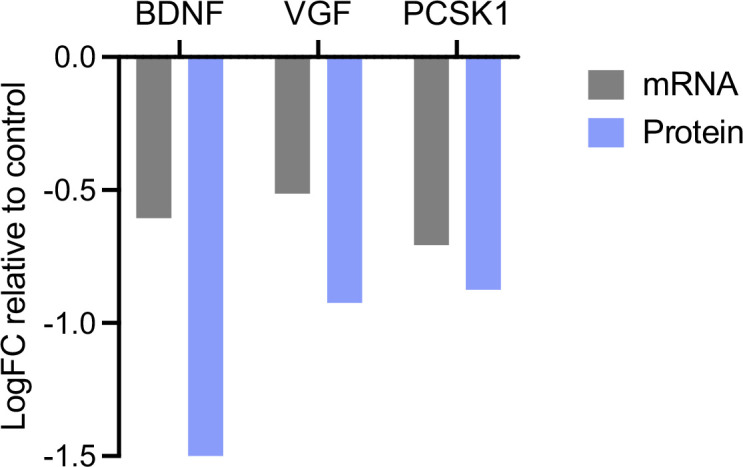
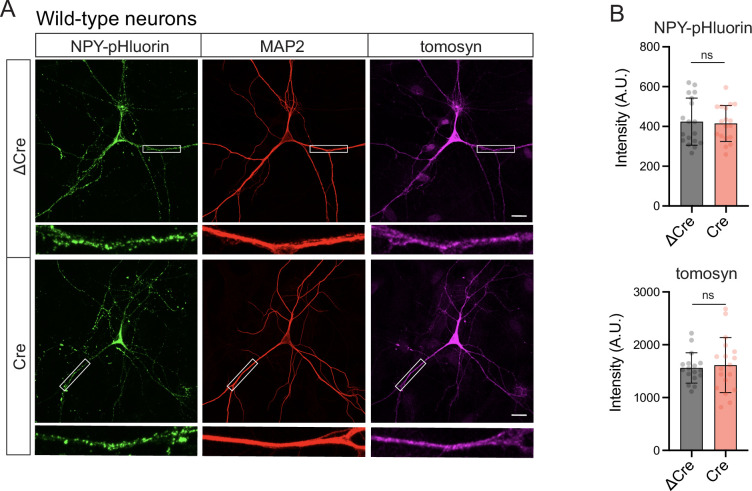
Figure 6—figure supplement 1. Comparison of mRNA and protein levels of brain-derived neurotrophic factor (BDNF), VGF, and PCSK1 in double knockout (DKO) neurons.


