. 2023 Sep 11;12:e58300. doi: 10.7554/eLife.58300

Figure 1. Cell-type-specific endothelial cell markers highlight cellular diversity within the vasculature.

(A) Uniform manifold approximation projection (UMAP) plots of scRNA-seq data of total endothelial lineage cells collected from TgBAC(etv2:Kaede)ci6, Tg(fli1:DsRed)um13; Tg(tp1:GFP)um14, and Tg(drl:H2B-dendra) embryos at 22–24 hpf. Clusters were named according to their gene expression: Erythroid, Lymphoid, General Endothelium (GE), Hemogenic Endothelium (HE), Pre-HSCs, Brain Vascular Endothelial Cells (BVECs-I and BVECs-II), Kidney Vascular Endothelial cells (KVECs), Endocardial Endothelial Cells (EECs), and somite-derived endothelial cells (SDECs). Color-coded marker gene expression levels are shown on corresponding clusters. A pink circle highlights the SDEC cluster. (B) Expression heatmap of 22–24 hpf single-cell transcriptome shows the top predicted differentially expressed marker genes across the different clusters. A red box highlights the SDEC cluster. (C’,C”) A list of somite-annotated genes was curated from the AmiGo annotation database and compared with the SDEC transcriptome. 32 genes were commonly expressed. Interestingly, several of these 32 genes were enriched within the SDEC cluster (C”; white boxed genes, D; enlarged circles).

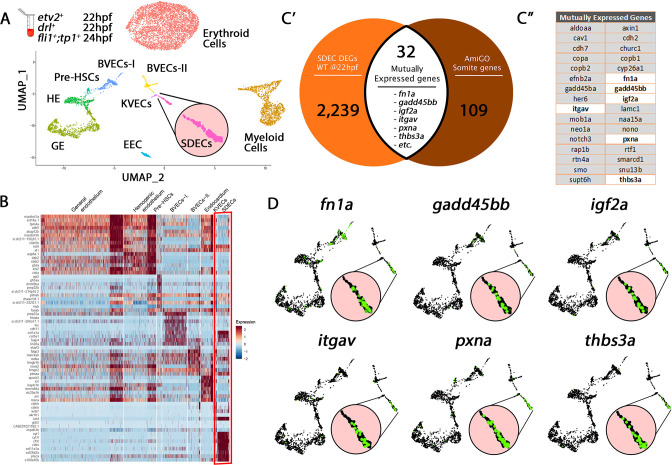
Figure 1—source data 1. Transcriptomes of all endothelial cell clusters, myeloid, and erythroid cells.
The transcriptomes were extracted and read from cells purified collected from TgBAC(etv2:Kaede)ci6, Tg(fli1:DsRed)um13; Tg(tp1:GFP)um14, and Tg(drl:H2B-dendra) embryos at 22–24 hpf.
Figure 1—source data 2. Comparison between Genes expressed in EC clusters (e.g. SDECs) and gene annotation of the same anatomical structure (e.g., somite) based on annotation from AmiGO (Consortium, 2019).
Expression of overlapping genes was compared in the same cluster (e.g. SDECs) between 15 ss and 22 hpf and divided into DE genes that are upregulated (Up) on downregulated (Down). Each DE group was then annotated using AmiGO (Consortium, 2019).
elife-58300-fig1-data2.xlsx (367.6KB, xlsx)

Figure 1.

Figure 1—figure supplement 1. Cluster identity was assigned based on known marker genes.

Figure 1—figure supplement 1.

(A–F) Following unsupervised clustering of single-cell transcriptomes, cluster identity was given based on known marker genes within established tissue lineages. Selected marker genes and the eight distinct endothelial cell clusters are shown (arrows, color-coded by their original cluster color in Figure 1A).
Figure 1—figure supplement 2. Comparison of BVECs-I cluster genes to brain annotated genes validates cluster origin.

Figure 1—figure supplement 2.

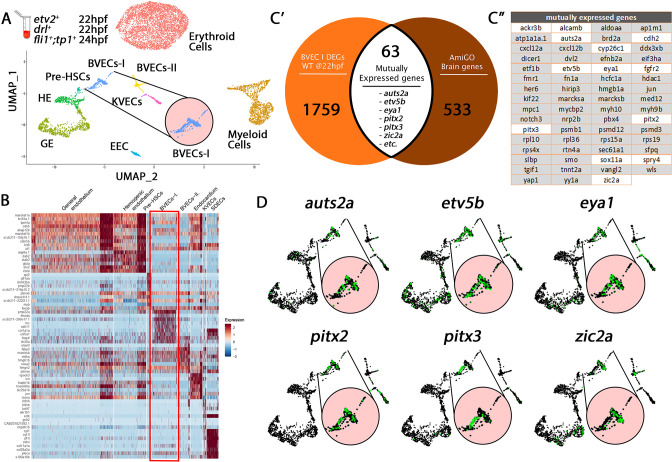
(A) Uniform manifold approximation projection (UMAP) plots of scRNA-seq data of total endothelial lineage cells collected from TgBAC(etv2:Kaede)ci6, Tg(fli1:DsRed)um13; Tg(tp1:GFP)um14, and Tg(drl:H2B-dendra) embryos at 22–24 hpf. Clusters were named according to their gene expression: Erythroid, Lymphoid, General Endothelium (GE), Hemogenic Endothelium (HE), Pre-HSCs, Brain Vascular Endothelial Cells (BVECs-I and BVECs-II), Kidney Vascular Endothelial cells (KVECs), Endocardial Endothelial Cells (EECs), and somite-derived endothelial cells (SDECs). Color-coded marker gene expression levels are shown on corresponding clusters. A pink circle highlights the BVECs-I cluster. (B) Expression heatmap of 22–24 hpf single-cell transcriptome showing the top predicted differentially expressed marker genes across the different clusters. A red box highlights the BVECs-I cluster. (C’,C”) A list of brain-annotated genes was curated from the AmiGo annotation database and compared with the BVECs-I transcriptome. 63 genes were commonly expressed. Interestingly, several of these 63 genes were enriched within the BVECs-I cluster (C”; white boxed genes, D; enlarged circles).
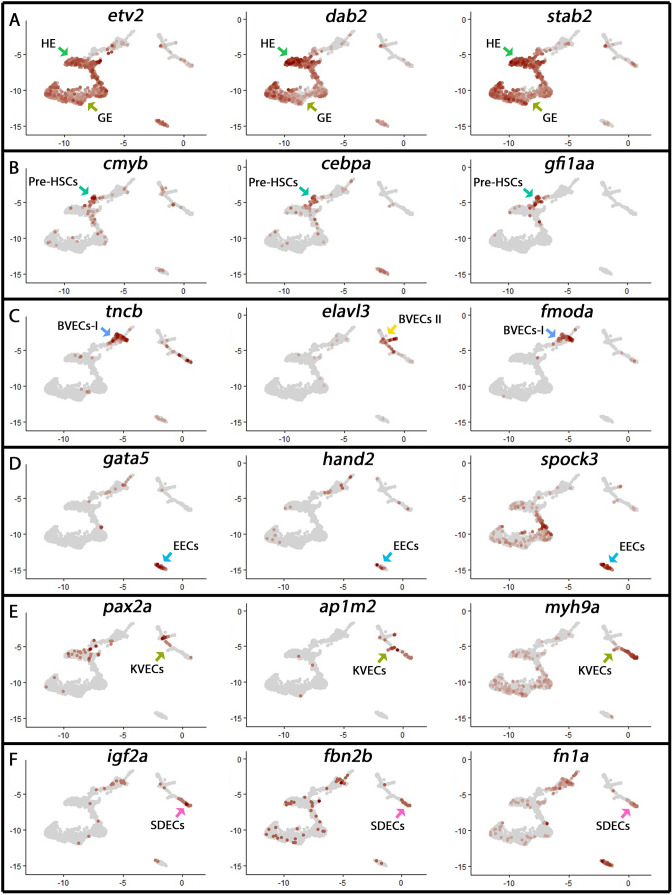
Figure 1—figure supplement 3. Comparison of KVEC Cluster genes to kidney annotated genes validates cluster origin.

Figure 1—figure supplement 3.

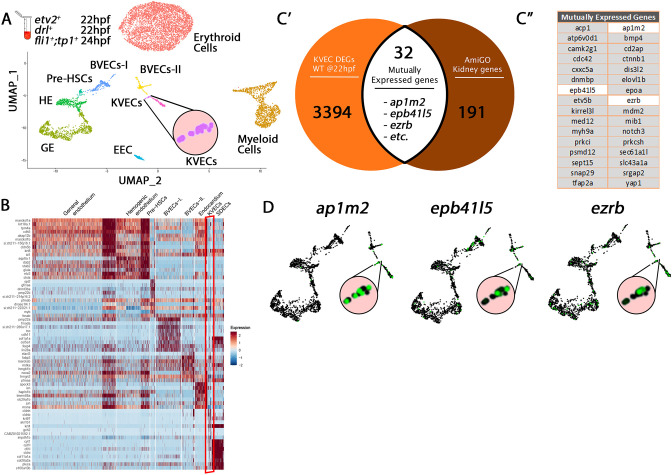
(A) Uniform manifold approximation projection (UMAP) plots of scRNA-seq data of total endothelial lineage cells collected from TgBAC(etv2:Kaede)ci6, Tg(fli1:DsRed)um13; Tg(tp1:GFP)um14, and Tg(drl:H2B-dendra) embryos at 22–24 hpf. Clusters were named according to their gene expression: Erythroid, Lymphoid, General Endothelium (GE), Hemogenic Endothelium (HE), Pre-HSCs, Brain Vascular Endothelial Cells (BVECs-I and BVECs-II), Kidney Vascular Endothelial cells (KVECs), Endocardial Endothelial Cells (EECs), and somite-derived endothelial cells (SDECs). Color-coded marker gene expression levels are shown on corresponding clusters. A pink circle highlights the KVECs cluster. (B) Expression heatmap of 22–24 hpf single-cell transcriptome showing the top predicted differentially expressed marker genes across the different clusters. A red box highlights the KVECs cluster. (C’,C” ) A list of kidney-annotated genes was curated from the AmiGo annotation database and compared with the KVECs transcriptome. 32 genes were commonly expressed. Interestingly, several of these 32 genes were enriched within the KVECs cluster (C”; white boxed genes, D; enlarged circles).