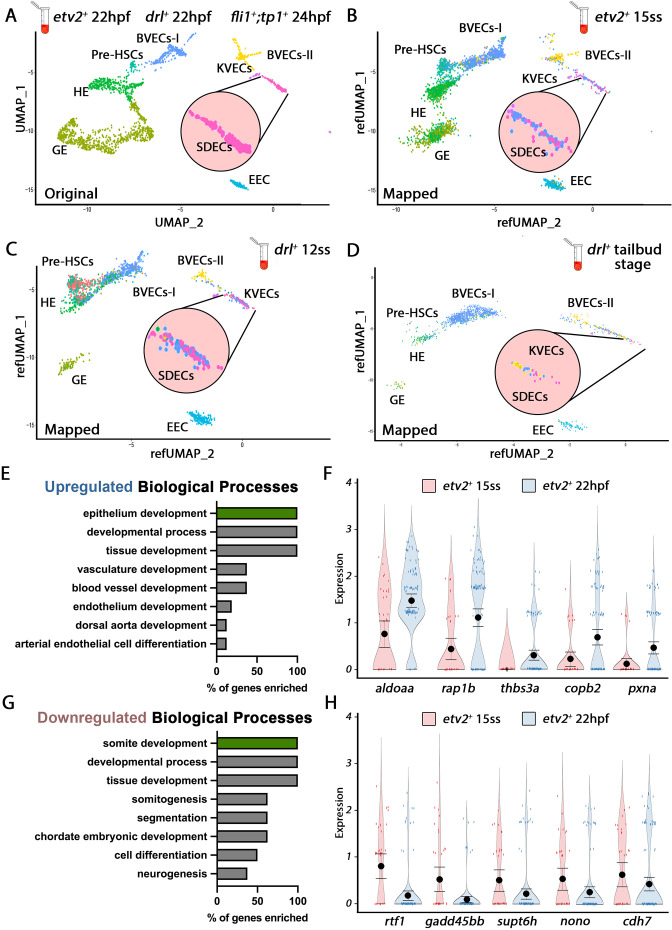
Figure 2. Cellular diversity within the vasculature can be traced back to the tailbud stage.
(A) Uniform manifold approximation projection (UMAP) plots of scRNA-seq data of total endothelial lineage cells collected from TgBAC(etv2:Kaede)ci6, Tg(fli1:DsRed)um13; Tg(tp1:GFP)um14, and Tg(drl:H2B-dendra) embryos at 22–24 hpf. Clusters were named according to their gene expression: General Endothelium (GE), Hemogenic Endothelium (HE), Pre-HSCs, Brain Vascular Endothelial Cells (BVECs-I and BVECs-II), Kidney Vascular Endothelial cells (KVECs), Endocardial Endothelial Cells (EEC), and somite-derived endothelial cells (SDECs). Color-coded marker gene expression levels are shown on corresponding clusters. A pink circle highlights the SDEC cluster. (B–D) Referenced uniform manifold approximation projection (RefUMAP) plots of scRNA-seq data of total endothelial lineage cells collected from etv2:Kaede+ embryos at 15 ss (B) and drl:H2B-dendra+ embryos at 12 ss (C) and tailbud stage (D). By cross-referencing the transcriptomes of EC subsets at each developmental stage to the 22–24 hpf ECs, we identified EC clusters with distinct transcriptomes as early as the tailbud stage. (E–H) Comparison of expression patterns of EC populations from early TgBAC(etv2:Kaede)ci6 15 ss, and later 22 hpf etv2:Kaede+ in the 32 overlapping genes between the SDEC transcriptome data and the AmiGo somite annotated genes. (E,F) Representative genes that were upregulated in the etv2:Kaede+ 22 hpf samples compared to the 15 ss sample (F) and their suggested role in EC differentiation, according to GO biological processes (E). (G,H) Representative genes that were downregulated in the etv2:Kaede+ 22 hpf samples compared to the 15 ss sample (H) and their suggested role in somitogenesis, according to GO biological processes (G). The expression and downregulation of somitic genes within etv2+ ECs between 15 ss and 22 hpf highlight their somitic origin and loss of myogenic cell fate.


