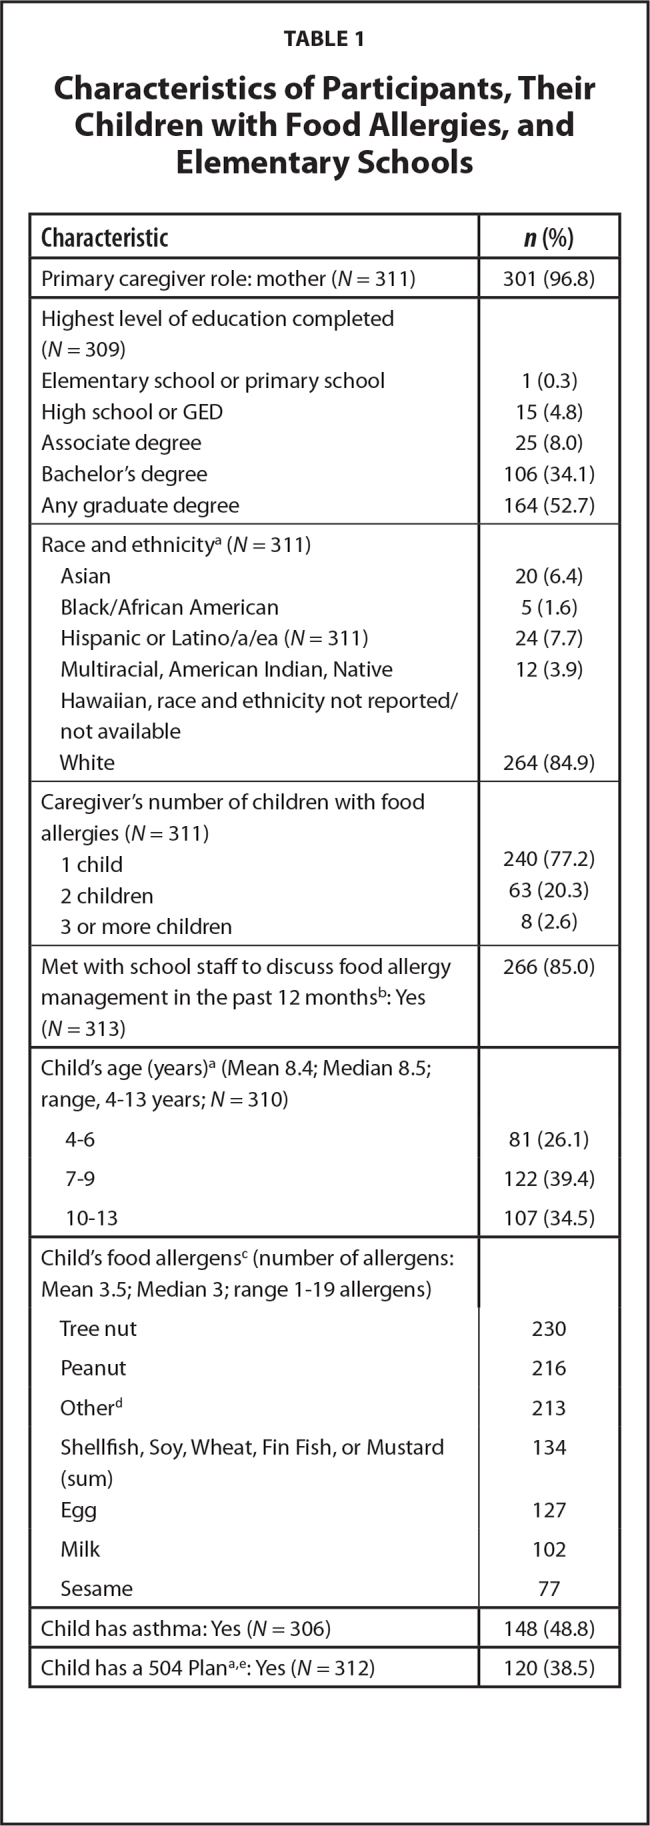
Table 1.
Characteristics of Participants, Their Children with Food Allergies, and Elementary Schools

| Characteristic | n (%) |
|---|---|
|
| |
| Primary caregiver role: mother (N = 311) | 301 (96.8) |
|
| |
| Highest level of education completed (N = 309) | |
| Elementary school or primary school | 1 (0.3) |
| High school or GED | 15 (4.8) |
| Associate degree | 25 (8.0) |
| Bachelor's degree | 106 (34.1) |
| Any graduate degree | 164 (52.7) |
|
| |
| Race and ethnicitya (N = 311) | |
| Asian | 20 (6.4) |
| Black/African American | 5 (1.6) |
| Hispanic or Latino/a/ea (N = 311) | 24 (7.7) |
| Multiracial, American Indian, Native | 12 (3.9) |
| Hawaiian, race and ethnicity not reported/not available | |
| White | 264 (84.9) |
|
| |
| Caregiver's number of children with food allergies (N = 311) | |
| 1 child | 240 (77.2) |
| 2 children | 63 (20.3) |
| 3 or more children | 8 (2.6) |
|
| |
| Met with school staff to discuss food allergy management in the past 12 monthsb: Yes (N = 313) | 266 (85.0) |
|
| |
| Child's age (years)a (Mean 8.4; Median 8.5; range, 4–13 years; N = 310) | |
| 4–6 | 81 (26.1) |
| 7–9 | 122 (39.4) |
| 10–13 | 107 (34.5) |
|
| |
| Child's food allergensc (number of allergens: Mean 3.5; Median 3; range 1–19 allergens) | |
| Tree nut | 230 |
| Peanut | 216 |
| Otherd | 213 |
| Shellfish, Soy, Wheat, Fin Fish, or Mustard (sum) | 134 |
| Egg | 127 |
| Milk | 102 |
| Sesame | 77 |
|
| |
| Child has asthma: Yes (N = 306) | 148 (48.8) |
|
| |
| Child has a 504 Plana,e: Yes (N = 312) | 120 (38.5) |
