Figure 2.
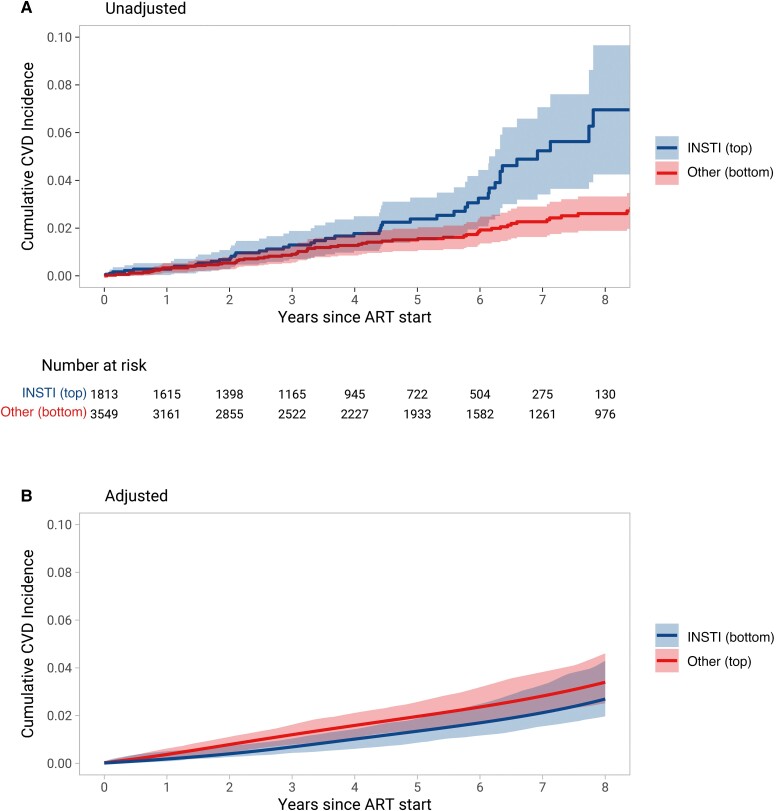
Cumulative incidence of cardiovascular disease (CVD) events after starting antiretroviral therapy. (A) The curves represent the unadjusted cumulative incidence of CVD events over time. (B) Curves of cumulative CVD incidence, adjusted for confounders and informative censoring (see Methods section for a full list of covariates). Shaded areas represent 95% confidence intervals.

