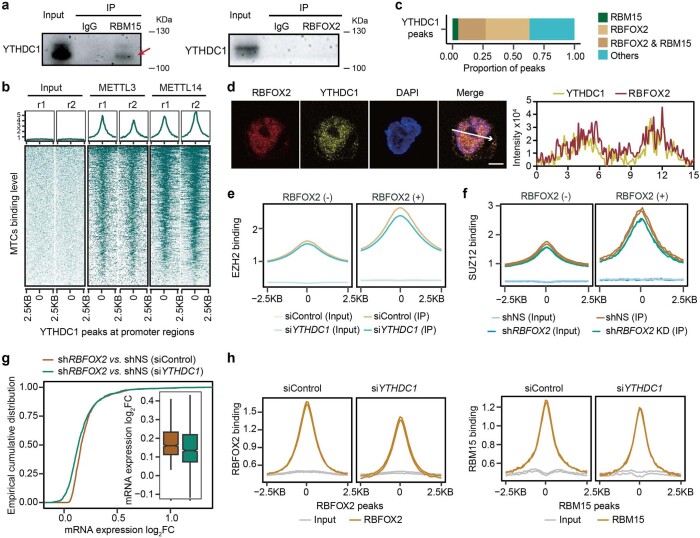
Extended Data Fig. 4. RBFOX2 regulates chromatin state through the m6A/RBM15/YTHDC1/PRC2 axis.
a, Western blots of immunoprecipitated RBFOX2 and RBM15 from K562 cells and their interactions with YTHDC1 after RNase A/T1 treatment. b, Heatmap showing the binding intensity of METTL3 and METTL14 at YTHDC1-marked promoter regions. c, Barplot showing the proportion of YTHDC1 peaks overlapping with RBFOX2 or RMB15 in K562 cells. d, Immunofluorescence images (left panel) and intensity profile (right panel) of RBFOX2 protein (red) and YTHDC1 protein (yellow) showing their colocalization in K562 cells. Scale bar, 5μM. e, Average profile showing EZH2 level at their peak centers and the flanking 2.5 kb regions in YTHDC1 KD (siYTHDC1) versus control (siControl) K562 cells. EZH2 peaks were categorized into RBFOX2 bound (+) and unbound (−) subgroups. f, Average profile showing SUZ12 binding signals at their peak centers and the flanking 2.5 kb regions in RBFOX2 KD versus control K562 cells. SUZ12 peaks were categorized into RBFOX2 bound (+) and unbound (−) subgroups. g, Cumulative distribution of gene expression changes in siControl K562 cells upon RBFOX2 knockdown versus control, as well as in YTHDC1 knockdown K562 cells upon RBFOX2 knockdown versus control. The displayed genes (N = 1221) were those that were upregulated upon RBFOX2 knockdown in siControl K562 cells and bound by RBFOX2 at their promoter regions. h, Average profile of RBFOX2 (left panel) or RBM15 (right panel) at their respective peak centers and the flanking 2.5 kb regions in Control (siControl) versus YTHDC1 knockdown (siYTHDC1) K562 cells.

