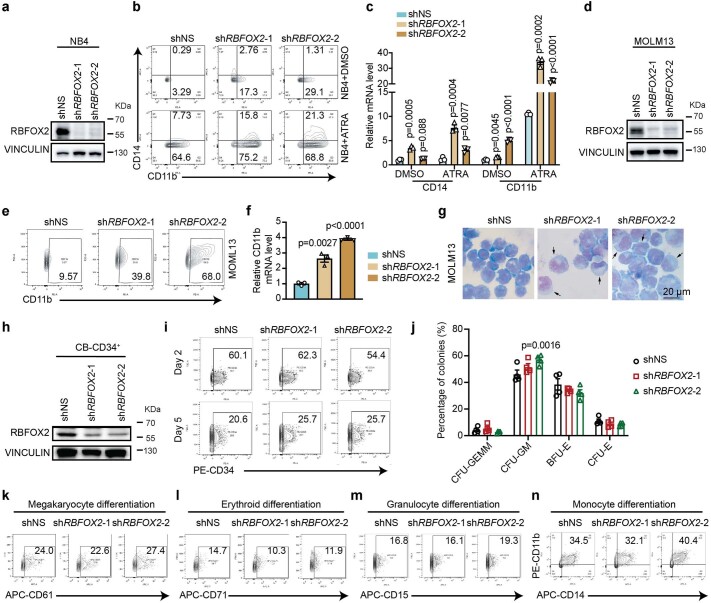
Extended Data Fig. 6. RBFOX2 knockdown promotes the differentiation of leukemia cells.
a, Western blot assay to quantify RBFOX2 knockdown efficiency in NB4 cells. b-c, Flow cytometric analysis of CD11b+ cell populations (b), and relative gene expression of CD14 and CD11b with qPCR quantification (c) in control (shNS) and RBFOX2 KD (shRBFOX2-1 and shRBFOX2-2) NB4 cells after treatment with 500 nM ATRA for 72 hr as compared to DMSO-treated cells. n = 3. d, Western blot assay to quantify RBFOX2 knockdown efficiency in MOLM13 cells. e-f, Flow cytometric analysis of CD11b+ cell populations (e) and CD11b mRNA expression level (f) in control (shNS) and RBFOX2 KD (shRBFOX2-1 and shRBFOX2-2) MOLM13 cells. n = 3. g, Wright-Giemsa staining of cytospin slides of control (shNS) and RBFOX2 KD (shRBFOX2-1 and shRBFOX2-2) MOLM13 cells. Arrows indicate differentiated cells. Scale bar, 20 µm. h, Western blots showing the knockdown efficiency of RBFOX2 in human cord blood-derived CD34+ (CB-CD34+) cells. i, Flow cytometric analysis of the percentage of CD34+ cell population in control (shNS) and RBFOX2 KD (shRBFOX2-1 and shRBFOX2-2) CB-CD34+ cells. Day 2 and Day 5 represent the number of days post-transduction. j, Quantification of the percentage of different hematopoietic lineage progenitor colonies in control (shNS) and RBFOX2 KD (shRBFOX2-1 and shRBFOX2-2) CB-CD34+ cells. n = 4. P values were calculated by two-way ANOVA, Dunnett’s multiple comparisons test. k-n, Flow cytometric analysis of megakaryocyte (k), erythroid (l), granulocyte (m) and monocyte (n) differentiation of CB-CD34+ cells (five days post-transduction) transfected with shNS or RBFOX2 shRNAs (shRBFOX2-1 and shRBFOX2-2). n, biologically independent samples. Data are presented as mean values +/− SEM. For c and f, two-sided P values by Student’s t-test.

