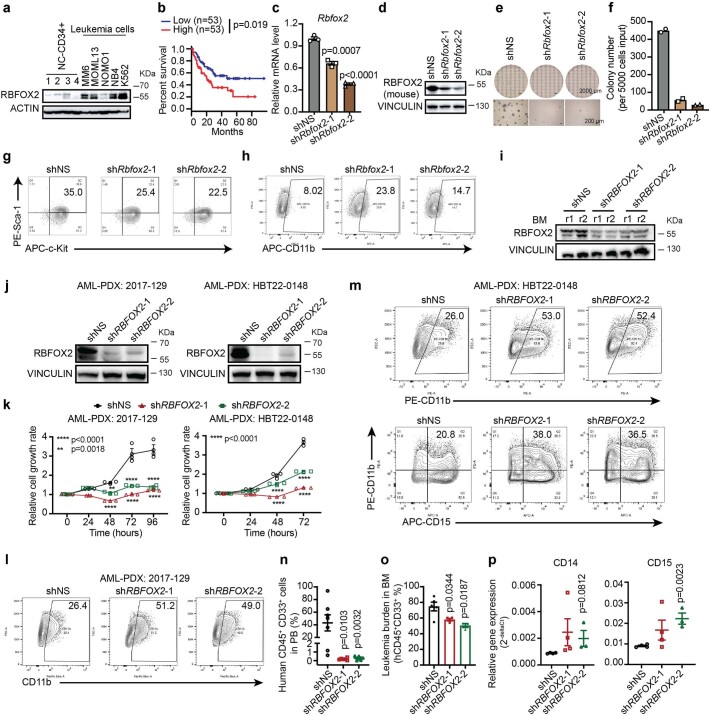
Extended Data Fig. 7. RBFOX2 knockdown blocks LSC self-renewal, and impairs AML progression in vivo.
a, Western blot of RBFOX2 protein in normal controls (human bone marrow CD43+) and AML cell lines. b, Kaplan-Meier survival analysis in TCGA-AML dataset (n = 106) using GEPIA. The patients were divided into two groups of equal size based on RBFOX2 levels. n, biologically independent patients. P value was detected by the log-rank test. c-d, Relative Rbfox2 gene expression quantified by qPCR (c, n = 3) and western blot assay (d) in control (shNS) and Rbfox2 KD (shRbfox2-1 and shRbfox2-2) mouse MLL-AF9 (MF9) cells. e-f, Image (e) and quantification (f, n = 2) of effects of Rbfox2 knockdown on the colony-forming of mouse MA9 AML cells. g, Flow cytometric analysis of LSC populations in mouse MA9 leukemia cells. h, Flow cytometric analysis of CD11b+ cell populations in mouse MA9 leukemia cells. i, Western blot of RBFOX2 protein in control (shNS) and RBFOX2 KD (shRBFOX2-1 and shRBFOX2-2) in in vivo bone marrow samples. j, Western blot showing RBFOX2 expression in control and RBFOX2 KD (shRBFOX2-1 and shRBFOX2-2) AML-PDX cells. k, Effects of RBFOX2 knockdown (shNS [n = 4], shRBFOX2-1 [n = 4] and shRBFOX2-2 [n = 3]) on AML-PDX cell growth. P value was calculated by one-way ANOVA, Dunnett’s multiple comparisons test. l, Flow cytometric analysis of CD11b+ cell populations in control and RBFOX2 KD AML-PDX cell (2017-129). m, Flow cytometric analysis of CD11b+ (top panel) or CD11b+ and CD15+ (bottom panel) cell populations in control and RBFOX2 KD AML-PDX cell (HBT22-0148). n, The hCD45 and hCD33 double positive cells (CD45+CD33+) were utilized to determine the engraftment of human AML-PDX cells (2017-12944) in recipient mice on day 34 post xeno-transplantation (shNS [n = 8], shRBFOX2-1 [n = 7] and shRBFOX2-2 [n = 9]). o, Quantification of leukemia burden in control (shNS [n = 5]) and RBFOX2 KD (shRBFOX2-1 [n = 4] and shRBFOX2-2 [n = 3]) bone marrow (BM) cells. p, Relative gene expression of CD14 and CD15 in control (shNS [n = 4)) and RBFOX2 KD (shRBFOX2-1 [n = 4] and shRBFOX2-2 [n = 3]) BM cells. n, biologically independent mice. Data are presented as mean values +/− SEM. For c, n, o and p, two-sided P values by Student’s t-test.

