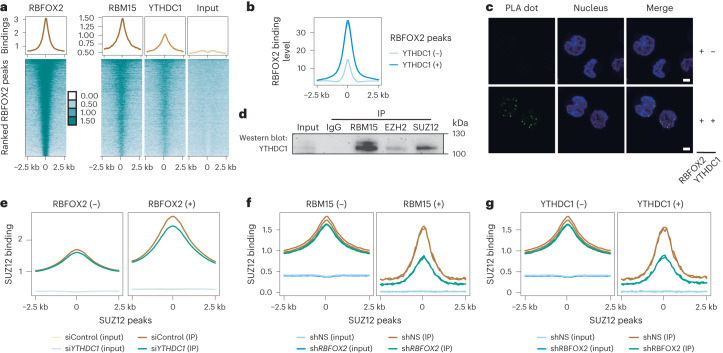
Fig. 3. RBFOX2 regulates chromatin state through the m6A/RBM15/YTHDC1/PRC2 axis.
a, Average profile (top) and heat map (bottom) showing RBFOX2, RBM15, YTHDC1 and the corresponding input signal at RBFOX2 peak centres and the flanking 2.5 kb regions in K562 cells. b, Average profile of RBFOX2 binding intensity at RBFOX2 peak centres and the flanking 2.5 kb regions in K562 cells. RBFOX2 peaks were categorized into two groups according to whether they overlap with YTHDC1 (+) or not (−). c, In situ PLA38 assay detecting the interaction (green) between RBFOX2 and YTHDC1 in K562 cells. Nuclei were stained with Hoechst 33342 (blue). Scale bar, 5 µm. d, Western blots of the immunoprecipitated RBM15, EZH2 and SUZ12, respectively, from K562 cells and their interactions with YTHDC1 after RNase A/T1 treatment. e, Average profile showing SUZ12 binding signal at their peak centres and the flanking 2.5 kb regions in YTHDC1 KD (siYTHDC1) versus control (siControl) K562 cells. SUZ12 peaks were categorized into two groups according to whether they overlap with RBFOX2 (+) or not (−). f,g, Average profile showing SUZ12 binding signal at their peak centres and the flanking 2.5 kb regions in RBFOX2 KD versus control K562 cells. SUZ12 peaks were categorized into two groups according to whether (+) or not (−) they were overlapped with RBM15 (f) or YTHDC1 (g). The depicted genome-wide data represent an integration of all samples, including two biologically independent replicates.

