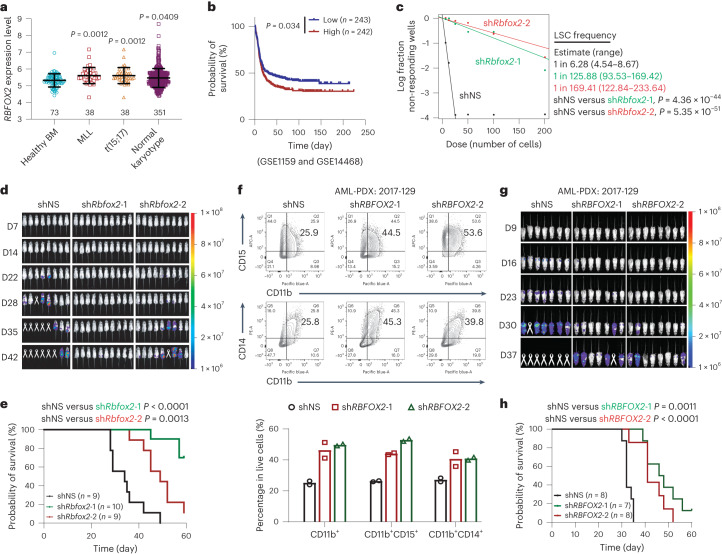
Fig. 5. RBFOX2 is aberrantly expressed in AML and RBFOX2 depletion impairs leukaemia progression in vivo.
a, Expression levels of RBFOX2 in patients with primary AML bearing chromosomal translocations and those in bone marrow (BM) HSCs collected from healthy donors (healthy BM) (GSE13159 (ref. 49)). n = 73 for healthy BM, n = 38 for MLL, n = 38 for t(15;17) and n = 351 for normal karyotype. Two-sided P values were calculated by Student’s t-test. b, Kaplan–Meier survival analysis in GSE1159 (ref. 50) and GSE14468 (ref. 51) dataset (n = 485). The patients were divided into two groups of equal size based on RBFOX2 levels. c, In vitro LDAs. Logarithmic plot showing the percentage of non-responding wells at different doses. Non-responding wells are wells not containing colony-forming cells. The estimated LSC/LIC frequency is calculated by ELDA and shown on the right. d, Bioluminescence imaging of mice transplanted with luciferase-expressing MOLM13 cells transfected with control (shNS) and RBFOX2 shRNAs (shRBFOX2-1 and shRBFOX2-2), respectively. D, day. e, Kaplan–Meier survival curves of recipient mice transplanted with control (n = 9) and two RBFOX2 KD (n = 10 for shRBFOX2-1 and n = 9 for shRBFOX2-2) MOLM13 cells. f, Flow cytometric analysis (top) and quantification (bottom) of CD11b+ cell populations in control and RBFOX2 KD AML-PDX cells (2017-129 (ref. 44)). n = 2. g, Bioluminescence imaging of mice transplanted with luciferase-expressing AML-PDX cells (2017-129 (ref. 44)) transduced with shNS and RBFOX2 shRNAs (shRBFOX2-1 and shRBFOX2-2), respectively. h, Kaplan–Meier survival curves of recipient mice transplanted with control (n = 8) and RBFOX2 KD (n = 7 for shRBFOX2-1 and n = 8 for shRBFOX2-2) AML-PDX cells (2017-129 (ref. 44)). n, biologically independent samples. Data are presented as mean ± standard error of the mean. For b, c, e and h, P values were calculated by the log-rank test.

