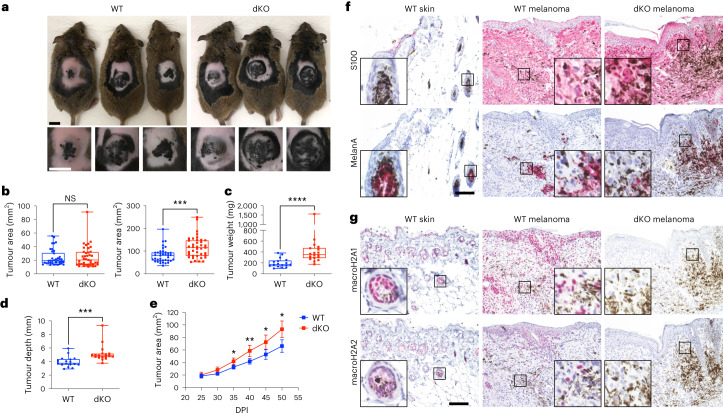
Fig. 1. MacroH2A loss in the melanoma TME promotes primary tumour growth.
a, Macroscopic appearance of BRAFV600E/PTEN-deficient autochthonous melanomas in macroH2A WT mice and in dKO mice at 50 DPI. b, Comparison of tumour area across genotypes at the indicated time points. nWT = 38, ndKO = 39. P = 0.7962 at 25 DPI, P = 0.0002 at 50 DPI. c, Measured weight of resected tumours at the end point (50 DPI). nWT = 17, ndKO = 18. P < 0.0001. d, Average tumour depth calculated from the tumour area and volume at the end point (50 DPI). nWT = 17, ndKO = 18. For b–d, significance was determined using Mann–Whitney two-tailed test. Box plot whiskers represent the minimum to maximum range, the box plot limits the 25th to 75th percentiles, and the centre line the median. P = 0.0001. e, Tumour growth kinetics between 25 and 50 DPI. nWT = 22, ndKO = 22. Mean and 95% confidence interval error bars are shown. P values adjusted for multiple comparisons: *P < 0.05, **P < 0.01, Mann–Whitney two-tailed test. Exact P values are provided as numerical source data. f, Immunohistochemical characterization of normal dorsal skin and representative tumours in a. Antigens indicated are stained pink (Vector Red substrate). g, Immunohistochemical analysis as in f, but demonstrating macroH2A1 and macroH2A2 staining in normal skin and in WT and dKO melanoma. For f and g, insets are shown at additional ×4 magnification. Staining was repeated on nWT skin = 2, nWT melanoma = 7, ndKO melanoma = 6 mice with similar results. Scale bars, 100 μm (f,g) or 1 cm (a). NS, not significant.

