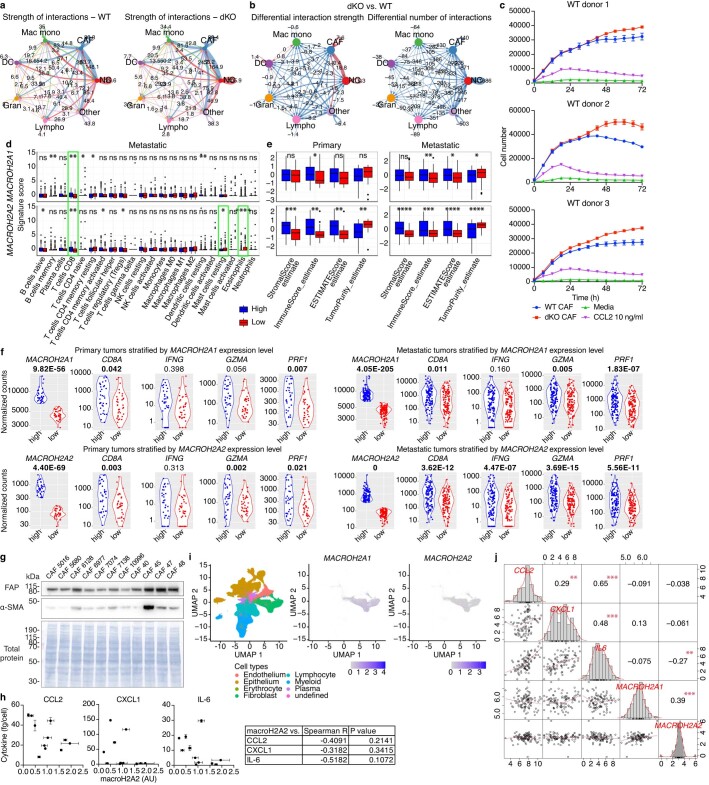
Extended Data Fig. 5. MacroH2A regulates pro-inflammatory signals in mouse and human melanoma CAFs.
a) Ligand-receptor analysis of cell signaling performed with CellChat110 summarizing interaction strength between broad cell types. Arrows depicting signaling direction are colored according to emitting cell type. Arrow weight is proportional to interaction strength. b) Differential interaction strength and number between WT and dKO cell type pairs. Arrows are colored according to direction of change (WT – blue, dKO – red) and weight represents amplitude of change. c) Transwell assay measuring the migration of CMFDA-labeled WT bone marrow-derived monocytes towards unlabelled WT or dKO CAFs. Average cell counts of 3 technical replicates and error bars representing SEM are shown for WT and dKO CAF conditions. No replicates are performed for negative and positive controls. Individual experiments using different monocyte donors shown. d) Comparison of deconvoluted immune cell type scores142 between TCGA metastatic melanoma tumors with MACROH2A1/2 high and low expression levels. n = 123 biologically independent samples per category. e) As in (d) for estimated immune, stromal and tumor purity scores143. nprimary = 35, nmetastatic = 123 biologically independent samples per category. d-e, Wilcoxon rank-sum test P-values adjusted for multiple comparisons shown: * < 0.05, ** < 0.01, *** < 0.001, **** < 0.0001. Exact P-values are provided as numerical source data. Box plot center line represents the median, box plot limits – 25th to 75th percentiles, whiskers extend from the box limit to the most extreme value no further than 1.5 * inter-quartile range from the box limit, any data beyond whiskers is plotted as individual points. f) Expression of genes associated with anti-tumor cytotoxic activity in human primary and metastatic melanoma samples from the TCGA cohort, segregated by MACROH2A1 or MACROH2A2 gene expression levels. High and low terciles are compared. Independent hypothesis weighted Wald test P-values adjusted for multiple comparisons, computed by DESeq2, shown. g) Detection of CAF markers by western blot in a panel of 11 human melanoma primary CAF cultures. Membrane stain for total protein shown for loading control. h) Correlation between macroH2A2 protein levels and indicated cytokine secretion in CAF cultures from (g). n = 11 biologically independent samples. Error bars correspond to SEM of 3 technical replicates of blot-based quantification for macroH2A2 and up to 3 dilutions each in 2 technical replicates for cytokine ELISA. Spearman correlation statistics, calculated on the average values without considering individual technical replicates, are shown. i) UMAP plots of a human pan-cancer scRNA-seq dataset60, together with macroH2A gene expression in fibroblasts. j) Correlation analysis between pseudobulk expression levels of selected cytokines and macroH2A genes in CAFs from (i). Pearson correlation coefficients and significance shown above the diagonal, pairwise scatter plots shown below. Histograms of individual gene expression comprise the diagonal. P-values shown: ** < 0.01, *** < 0.001. Exact P-values are provided as numerical source data.

