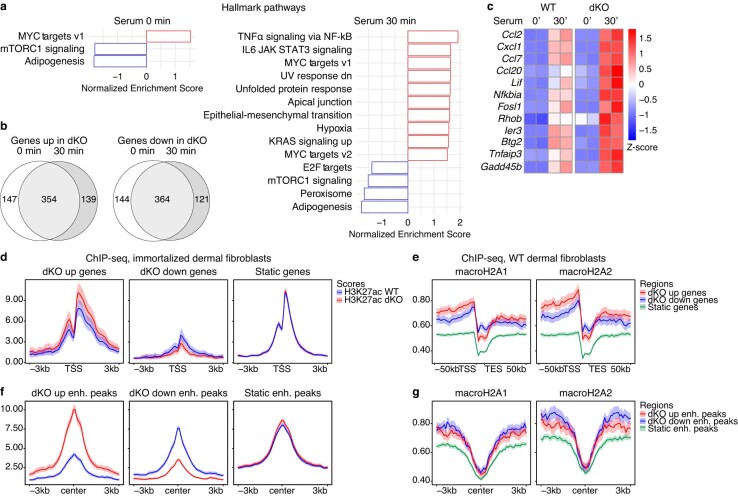
Extended Data Fig. 8. Transcriptomic and enhancer analysis in the absence of macroH2A in iDFs.
a) Significant Hallmark pathways in GSEA analysis of dKO vs. WT performed in iDFs prior to (0 min) and post serum stimulation (30 min). b) Venn diagrams representing the extent of overlap between pre- and post- serum stimulation in genes up- and downregulated by macroH2A deficiency in iDFs. c) Heatmap of a subset of inflammatory genes hyper-induced by serum stimulation in the absence of macroH2A. d) Average profile of H3K27ac ChIP signal in serum-stimulated WT vs. dKO iDFs at promoters of all differentially expressed and static genes of matched expression levels following serum stimulation, ndKO up = 494, ndKO down = 485, nStatic = 2937. e) Average profile of macroH2A1 and macroH2A2 signal62 in dermal fibroblasts at genes described in (d). f) As in (d), for enhancer H3K27ac peaks differentially enriched in H3K27ac, ndKO up = 1438, ndKO down = 1764, nStatic = 7037. g) Average profile of macroH2A1 and macroH2A2 signal in dermal fibroblasts at regions described in (f). d-g, mean signal value and 95% CI as determined by bootstrap shown.

