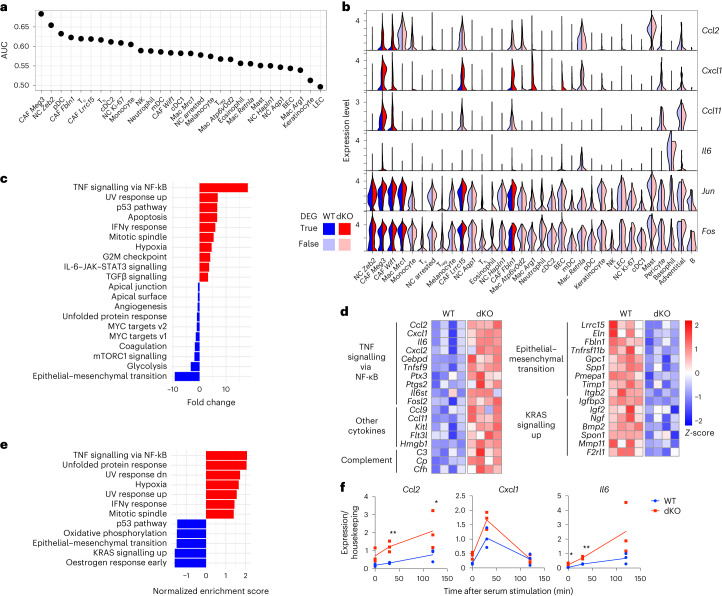
Fig. 4. Pro-inflammatory signals in dKO tumours originate from CAFs.
a, Prioritization of the contribution of each cell cluster to gene expression changes in dKO versus WT samples using Augur, a method that measures the separation in gene expression space between cells in each cluster as a function of genotype. AUC, area under the curve. b, Genes of interest with significant upregulation in dKO samples in clusters highlighted in bold colours (Wilcoxon rank-sum test adjusted P < 0.05). P values are provided in Supplementary Table 3. c, Significant hallmark pathways in a GSEA of dKO versus WT samples performed in the CAF Meg3 cluster. d, Heatmap of DEGs in CAFs sorted by flow cytometry from WT and dKO melanomas at 50 DPI, grouped under selected top gene enrichment terms defined using Homer analysis. Each column represents CAFs from an independent tumour. Expression values are normalized row-wise as Z-scores. e, Significant hallmark pathways in GSEA of sorted CAFs as in d. f, Expression normalized to housekeeping controls of indicated cytokine genes determined by reverse transcription-qPCR in cultured CAFs isolated from WT and dKO tumours at the indicated times following serum stimulation. Line represents the mean of three independently performed experiments shown. Ratio paired two-tailed t-test P values shown: *P < 0.05, **P < 0.01. Exact P values are provided as numerical source data. Non-significant differences are not labelled.

