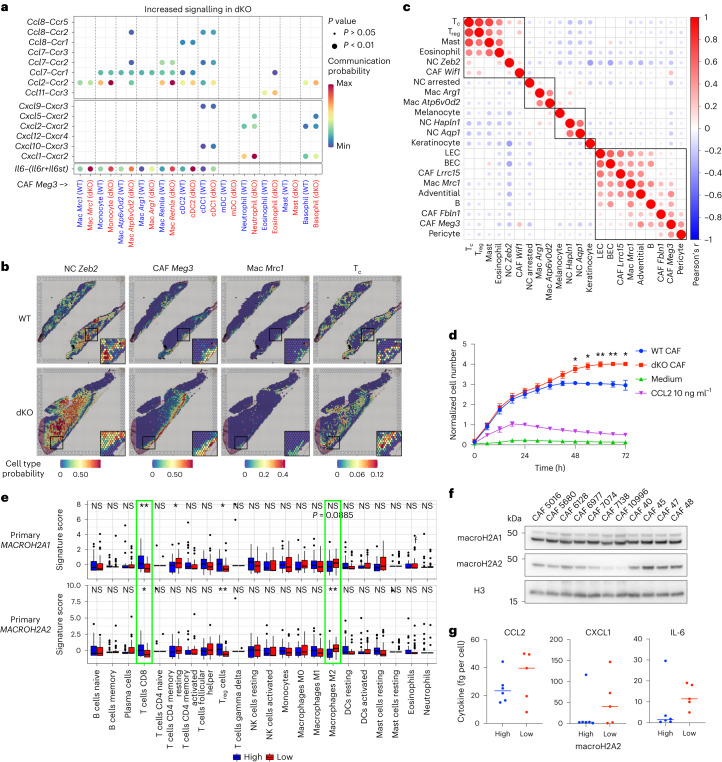
Fig. 5. CAFs are the source of pro-inflammatory signals in the dKO TME.
a, Comparison of signalling probability along CCL, CXCL and IL-6 pathways leveraging scRNA-seq data from CAF Meg3 cells to myeloid cell clusters. Dots represent significant ligand–receptor interaction pairs with increased signalling in the dKO. The dot colour represents communication probability, the dot size represents the P value of one-sided permutation test, and the absence of a dot signifies a null probability of signalling. Exact P values are provided as numerical source data. b, Prediction of the spatial localization of indicated scRNA-seq cell clusters in WT and dKO melanoma by label transfer onto ST data. Insets are shown at ×2 magnification. c, Correlation analysis of cell-type scores for all scRNA-seq clusters detected in SC data, based on the combined set of WT and dKO spots. Dots shown correspond to significant correlations (two-tailed t-test adjusted for multiple comparisons, adjusted P < 0.05), heatmap colour corresponds to Pearson’s correlation coefficient. Exact P values are provided as numerical source data. Black squares represent hierarchical clusters of cell types based on correlation coefficients. d, Transwell assay measuring the migration of CMFDA-labelled WT bone-marrow-derived monocytes towards unlabelled WT or dKO CAFs. Monocyte counts are normalized to the CCL2 condition at 24 h. Summary of three independent experiments using different monocyte donors shown. Error bars represent s.e.m. Two-tailed t-test P values shown: *P < 0.05, **P < 0.01. Exact P values are provided as numerical source data. Non-significant differences are not labelled. e, Comparison of deconvoluted immune cell type scores between TCGA primary melanoma tumours with MACROH2A1 and MACROH2A2 high and low expression levels. Wilcoxon rank-sum test P values adjusted for multiple comparisons shown: *P < 0.05, **P < 0.01. Exact P values are provided as numerical source data. N = 35 biologically independent samples per category. The box plot centre line represents the median, the box plot limits indicate the 25th to 75th percentiles, the whiskers extend from the box limit to the most extreme value no further than 1.5× the inter-quartile range from the box limit, any data beyond whiskers are plotted as individual points. f, MacroH2A1 and macroH2A2 levels in a panel of 11 human melanoma CAF lines. Histone H3 was used as a control for total histone content. g, Indicated cytokine levels in CAF lines in f, stratified according to macroH2A2 levels along the median. Nhigh = 6, nlow = 5 biologically independent samples. The western blot was repeated three times.

