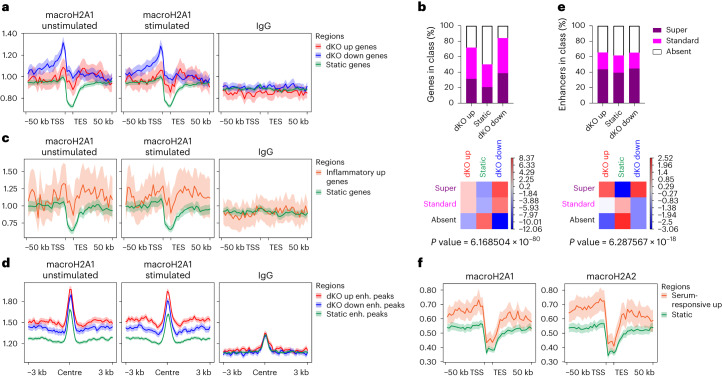
Fig. 6. MacroH2A-sensitive genes and enhancers occupy highly enriched macroH2A chromatin domains.
a, Metagene profile of macroH2A1 CUT&RUN signals in cultured WT CAFs before and after serum stimulation at genes differentially up or down or static genes of matched expression levels in dKO versus WT sorted CAFs. ndKO up = 357, ndKO down = 884, nStatic = 3,708. TES, transcription end site; TSS, transcription start site. b, Top, percentage of overlap between DEGs and MCDs. Bottom, deviation from random distribution shown as a heatmap of Chi-square test residuals, together with the associated P value. c, As in a, but at inflammatory genes upregulated in dKO sorted CAFs and static genes of matched expression levels. nInflammatory up = 39, nStatic = 385. d, Average profile of macroH2A CUT&RUN signals in cultured WT CAFs before and after serum stimulation centred around ATAC peaks located in enhancers (enh.) that gain, lose or maintain static H3K27ac levels in dKO versus WT tumours. ndKO up = 6,659, ndKO down = 5,211, nStatic = 18,961. Note the signal pattern at the centre of the ATAC peak, which is probably due to a bias of CUT&RUN for accessible chromatin sites. e, As in b, but for overlap between enhancers with peaks shown in d and MCDs. f, Average profile of macroH2A1 and macroH2A2 signals in dermal fibroblasts62 analysed by ChIP–seq at genes hyperinduced by serum stimulation in the absence of macroH2A and static genes of matched expression levels. nSerum-responsive up = 139, nStatic = 695. For a, c, d and f, mean signal value and 95% confidence interval as determined by bootstrap analysis are shown.

