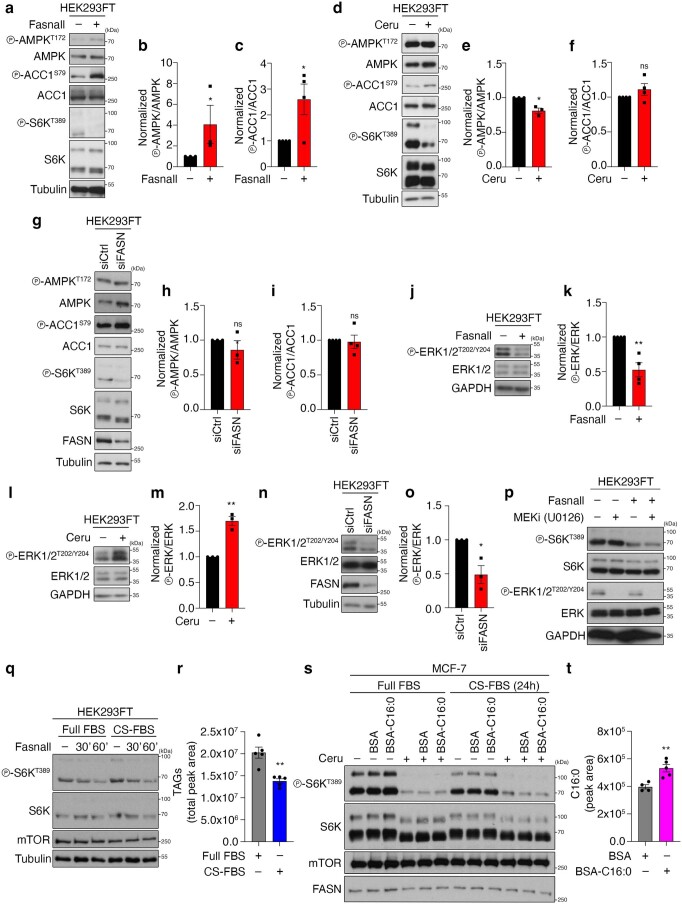
Extended Data Fig. 5. FASN inhibition/knockdown downregulates mTORC1 activity independently from changes in AMPK or ERK signalling and from lipid availability.
a–c, AMPK and ACC1 phosphorylation in cells treated with Fasnall. b, Quantification of AMPK phosphorylation; n = 3 independent experiments. c, Quantification of ACC1 phosphorylation; n = 4 independent experiments. d–f, As in a–c, but for cerulenin treatment; np-AMPK = 3 independent experiments and np-ACC1 = 4 independent experiments. g–i, As in a–c, but for FASN knockdown; np-AMPK = 3 independent experiments and np-ACC1 = 4 independent experiments. j,k, ERK1/2 phosphorylation in cells treated with Fasnall. k, Quantification of ERK phosphorylation; n = 4 independent experiments. l,m, As in j,k, but for cerulenin treatment; n = 3 independent experiments. n,o, As in j,k, but for FASN knockdown; n = 4 independent experiments. p, Pharmacological inhibition of MEK–ERK signalling does not influence the effect of FASN inhibition on mTORC1; n = 2 independent experiments. q,r, Depletion of exogenous lipid sources does not influence the mTORC1 response to FASN inhibition. HEK293FT cells were cultured in full FBS- or charcoal-stripped FBS (CS-FBS)-containing media for 24 h, and then treated with 25 μM Fasnall for 30 or 60 min, or DMSO as the control (–). q, mTORC1 activity was assessed by phosphorylation of S6K. r, Measurement of intracellular TAG levels; n = 5 biological replicates. s,t, Immunoblots with lysates from control (−) or cerulenin-treated (50 μM, 4 h) MCF-7 cells, supplemented with BSA-conjugated palmitate (C16:0) or BSA as control. Cells were cultured in full FBS- or charcoal-stripped FBS (CS-FBS)-containing media for 24 h before the treatments. s, mTORC1 activity was assayed by phosphorylation of S6K. t, Measurement of intracellular C16:0 levels, indicating uptake of BSA-conjugated palmitate; nBSA = 4 and nC16:0 = 5 biological replicates. Data in graphs are shown as the mean ± s.e.m. *P < 0.05, **P < 0.005. Source numerical data and unprocessed blots are provided.

