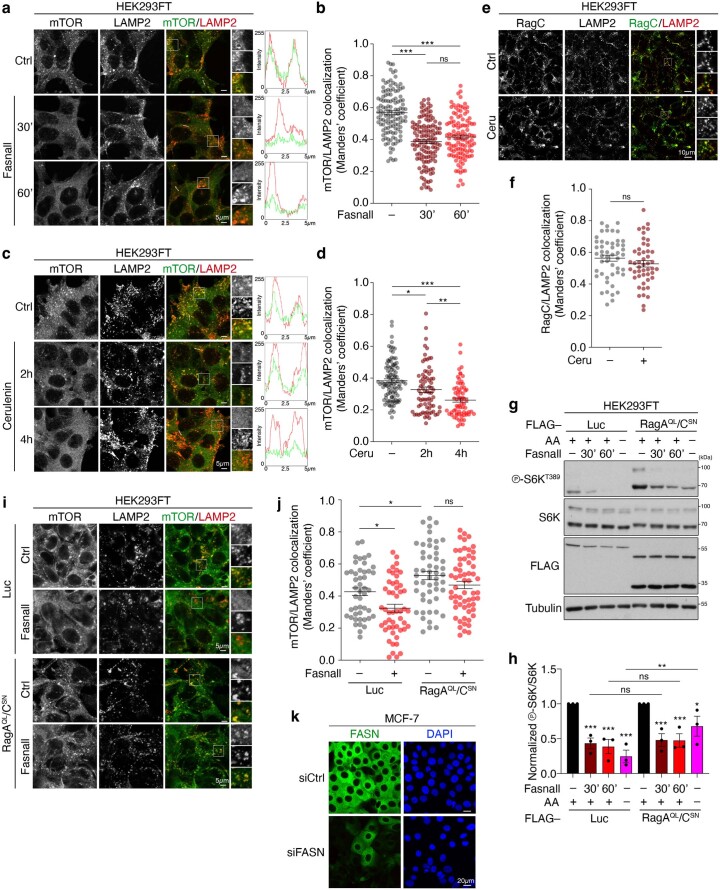
Extended Data Fig. 8. Downregulation of mTORC1 activity following FASN inhibition occurs independently of its lysosomal localization.
a, Co-localization analysis, using confocal microscopy, of mTOR with LAMP2 (lysosomal marker) in HEK293FT cells treated with 25 μM Fasnall for the indicated times. Magnified insets and intensity plots for selected regions shown on the right. Scale bars, 5 μm. b, Quantification of co-localization from nDMSO = 124, nFasnall_30’ = 130 and nFasnall_60’ = 117 individual cells. Pooled data from four independent experiments. c,d, As in a,b, but inhibiting FASN with 50 μM cerulenin for the indicated times. c, Scale bars, 5 μm. d, Quantification from nDMSO = 103, nCeru_2h = 74 and nCeru_4h = 69 individual cells. Pooled data from three independent experiments. e,f, RagC stays lysosomal following FASN inhibition. As in c,d, but for RagC/LAMP2 co-localization. Scale bars, 10 μm. f, Quantification of co-localization from nDMSO = 49 and nCeru_4h = 48 individual cells. Data from a representative experiment of two independent replicates are shown. g,h, Constitutively active Rags that blunt the amino-acid-starvation response do not prevent mTORC1 downregulation by FASN inhibition. g, HEK293FT cells were transiently transfected with vectors expressing FLAG-tagged RagAQL and RagCSN mutants, or Luciferase (Luc) as the control and treated with 25 μM Fasnall for the indicated times, or amino-acid starvation media for 1 h. h, Quantification of mTORC1 activity (p-S6KT389/S6K), normalized to each DMSO-treated control; n = 3 independent experiments. i,j, Co-localization analysis of mTOR with LAMP2 in HEK293FT cells transiently expressing FLAG-tagged RagAQL and RagCSN mutants, or Luciferase (Luc) as control, and treated with 25 μM Fasnall. i, Scale bars, 5 μm. j, Quantification of co-localization from nLuc_DMSO = 47, nLuc_Fasnall = 50, nRag_DMSO = 52 and nRag_Fasnall = 60 cells. Data from a representative experiment of two independent replicates are shown. k, Specific staining of endogenous FASN shown by knockdown (siFASN) and immunofluorescence. Nuclei were stained with DAPI. Scale bars, 20 μm; n = 3 independent experiments. Data in graphs are shown as the mean ± s.e.m. *P < 0.05, **P < 0.005, ***P < 0.0005. Source numerical data and unprocessed blots are provided.

