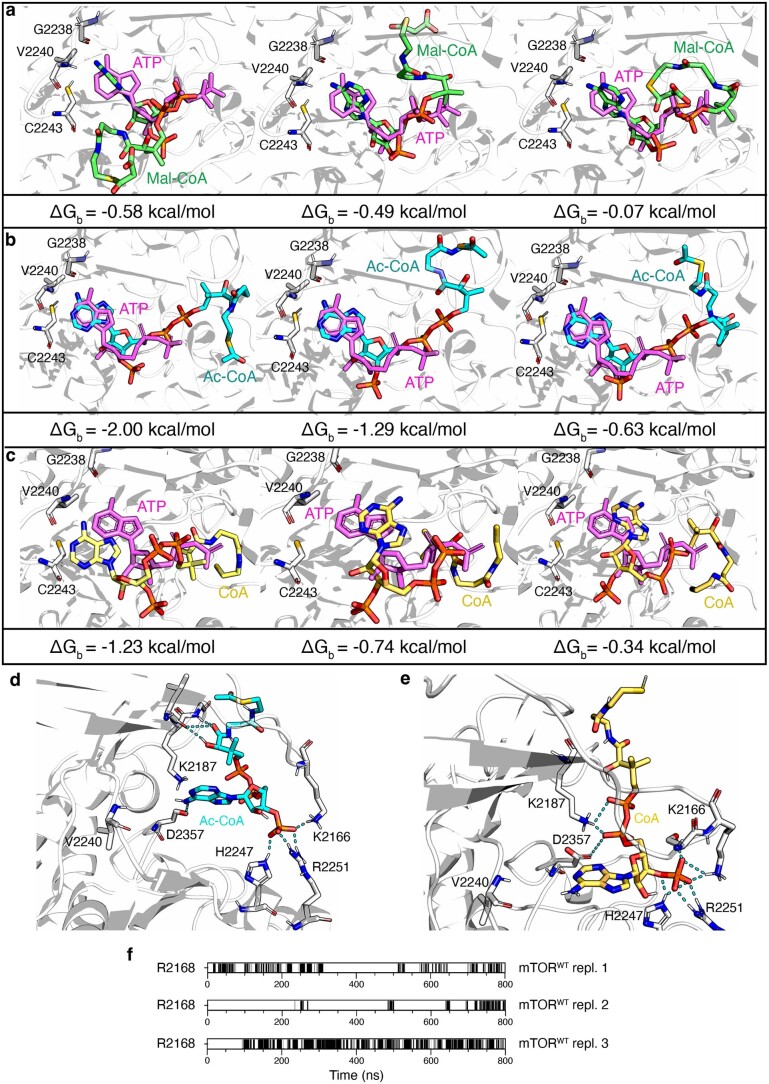
Extended Data Fig. 9. Site-specific docking simulations for Mal-CoA, Ac-CoA and CoA in the catalytic pocket of mTOR.
a, The best three docking poses of Mal-CoA (shown in green) aligned to ATP (violet) in the mTOR catalytic pocket. The binding energy value (ΔGb) for each conformation is shown below the docking models. These conformations were selected as the starting point to perform all atom molecular dynamics simulations. b, As in a, but for acetyl-CoA (Ac-CoA), shown in cyan. c, As in a, but for Coenzyme A (CoA), shown in yellow. d, Representative acetyl-CoA (Ac-CoA) placement in the mTOR binding pocket (b). Hydrogen bonds between the compounds and the amino-acid residues of the mTOR catalytic pocket indicated by cyan dotted lines. e, As in d, but for Coenzyme A (CoA), shown in yellow. f, Time evolution of hydrogen bonds between the carbonyl group of Mal-CoA and the R2168 residue of wild-type mTOR are reported for the three replicates of the molecular dynamics simulations.

