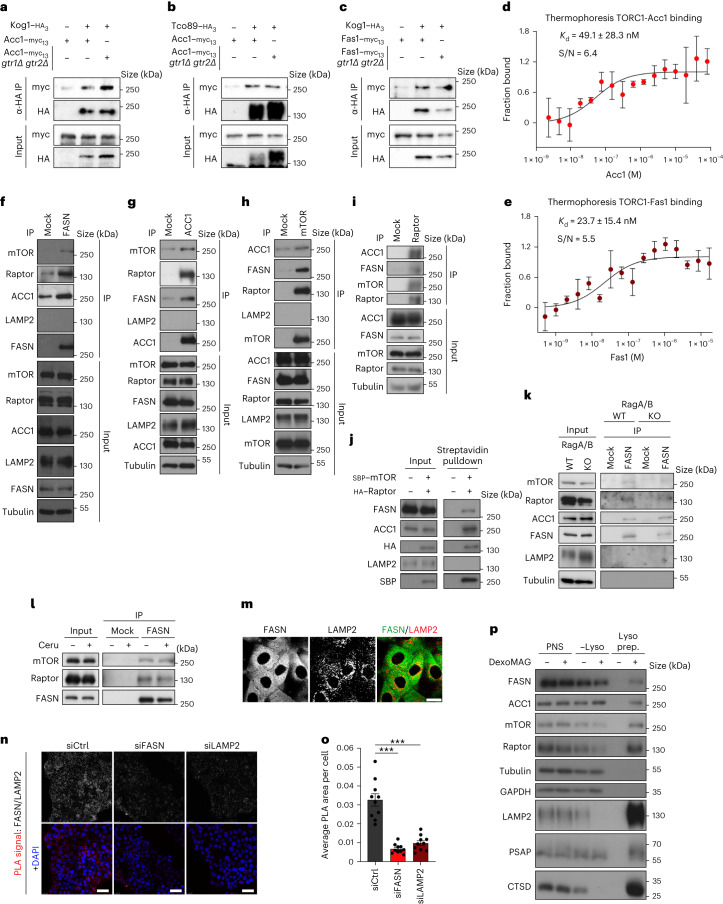
Fig. 6. The mTORC1–FASN–ACC1 proteins form reciprocal interactions in yeast and mammalian cells.
a,b, Acc1 physically interacts with TORC1 in a Rag-independent manner. Wild-type and gtr1Δ gtr2Δ cells expressing genomically tagged Acc1–myc13 and untagged (−) or genomically tagged (+) TORC1 subunits Kog1–HA3 (a) or Tco89–HA3 (b) were cultured to the exponential phase. The input and anti-HA IPs were analysed by immunoblotting (n = 3 independent experiments). c, As in a,b but with genomically tagged Fas1–myc13 and untagged or genomically tagged Kog1–HA3 (n = 3 independent experiments). d,e, Acc1 (d) and Fas1 (e) titration curves in MST binding affinity assays using fluorescent TORC1 as the target (n = 3 independent experiments). Data are the mean ± s.d.; S/N, signal-to-noise ratio. f, FASN interacts with mTOR, Raptor and ACC1 directly. Endogenous FASN was immunoprecipitated from HEK293FT cell lysates and the co-immunoprecipitated proteins were identified by immunoblotting as indicated. LAMP2 was used as the negative control (n = 8 independent experiments). g, As in f but with ACC1 immunoprecipitation (n = 4 independent experiments). h, As in f but with mTOR immunoprecipitation (n = 6 independent experiments). i, As in f but with Raptor immunoprecipitation (n = 3 independent experiments). j, Streptavidin pulldown experiments with HEK293FT cells expressing SBP–mTOR and HA–Raptor exogenously (n = 2 independent experiments). k, The interaction between FASN, mTOR/Raptor and ACC1 is independent of the Rags (n = 3 independent experiments using HEK293FT cells). l, The stability of the mTORC1–FASN interaction is not affected by FASN inhibition (n = 2 independent experiments using HEK293FT cells). m, Immunofluorescence of FASN and LAMP2 in MCF-7 cells. Scale bar, 10 μm (n = 3 independent experiments). n,o, FASN was detected in proximity to lysosomes. Antibodies to FASN and LAMP2 were used in PLA assays in MCF-7 cells. n, The specificity of the PLA signal (red dots) was verified by FASN and LAMP2 knockdown using siRNA. Scale bars, 25 μm; siCtrl, control siRNA; and siLAMP2, siRNA to LAMP2; and DAPI, 4,6-diamidino-2-phenylindole. o, Quantification of PLA signal intensity (n = 10 randomly selected fields from one representative experiment of four independent replicates). Data are the mean ± s.e.m. ***P < 0.0005. p, Lysosome enrichment assay with DexoMAG for the presence of the indicated proteins in the post-nuclear supernatant (PNS), non-lysosomal fraction (–Lyso) and lysosomal fraction (Lyso prep; n = 5 independent experiments). IP, immunoprecipitate; α-HA, anti-HA. Source numerical data and unprocessed blots are provided.

