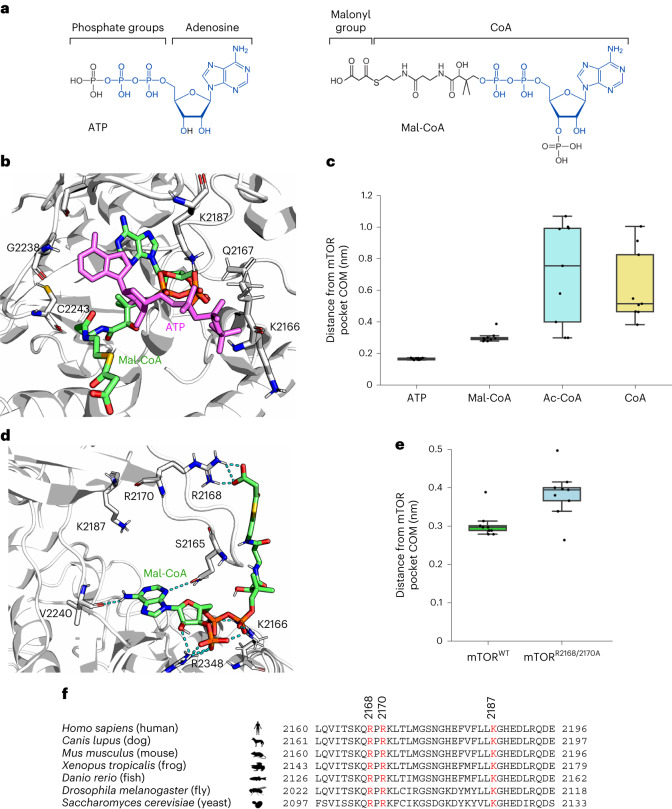
Fig. 7. Molecular dynamics simulation of Mal-CoA binding to the mTOR catalytic pocket.
a, Chemical structures of ATP (left) and Mal-CoA (right) highlighting structural similarities between the two molecules. Identical parts are marked in blue. b, Structural alignment of representative snapshots of Mal-CoA (green; initial conformation shown) and ATP (magenta) bound to the mTOR catalytic pocket (top view). c, Distances of the indicated ligands from the mTOR binding pocket during the molecular dynamics simulations. The distances were computed between the centre of mass (COM) of the adenine ring and the COM of the amino-acid residues defining the pocket (n = 9 measurements from three independent replicate runs, with three data points extracted per run for each compound). Individual data points represent the average over 100 ns of molecular dynamics simulation; Ac-CoA, acetyl-CoA. d, The malonyl group of Mal-CoA forms salt bridges with charged residues at the edge of the mTOR catalytic pocket (lateral view). Representative Mal-CoA (green) conformation sampled by molecular dynamics simulations. The hydrogen bonds established between Mal-CoA (final conformation in the simulation) and the amino-acid residues of the mTOR pocket are shown as cyan dotted lines. Note that only a snapshot is shown, with multiple residues participating in the formation of dynamic interactions with the malonyl group and R2168 being the most frequent. e, In silico mutagenesis of key mTOR residues weakens the interaction between Mal-CoA and mTOR. Distances of Mal-CoA from the mTOR binding pocket during the molecular dynamics simulations as in c comparing mTORWT and mTORR2168A/R2170A molecules (n = 9 measurements from three independent replicate runs, with three data points extracted per run). Individual data points represent the average over 100 ns of molecular dynamics simulation. f, Amino-acid sequence alignment of amino-acid residues 2160–2196 of human mTOR with the respective orthologous sequences from other organisms. Key conserved residues that participate in interactions with Mal-CoA are shown in red. c,e, Boxplots: central line, median; box, IQR (25th (Q1)–75th (Q3) percentile); and whiskers, Q3 + 1.5 × IQR and Q1 − 1.5 × IQR. Source numerical data are provided.

