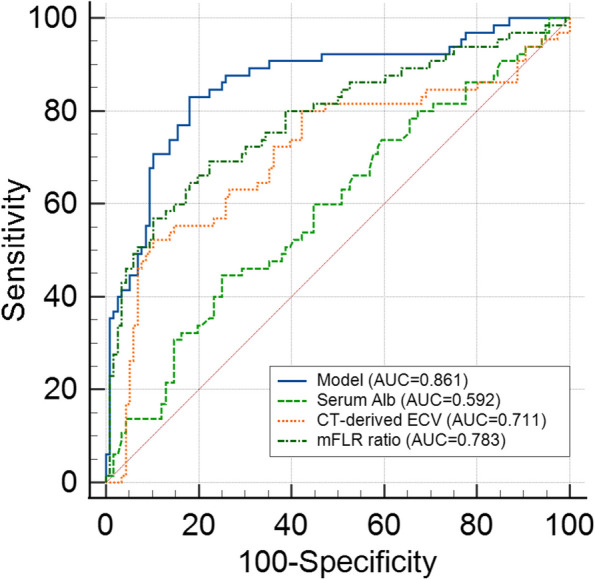
Fig. 2.

Receiver operating characteristic (ROC) curve analyses of the model, CT-derived ECV, mFLR ratio, serum Alb, and hepatic inflow occlusion duration to predict PHLF. The model for PHLF prediction in the training cohort had a significantly higher AUC (0.861, 95% CI: 0.802–0.908) than those of CT-derived ECV, mFLR ratio, and serum Alb (DeLong test: all p < 0.001). PHLF, posthepatectomy liver failure; HCC, hepatocellular carcinoma; CT, computed tomography; ECV, extracellular volume; mFLR, measured future liver remnant; Alb, albumin; AUC, area under the curve
