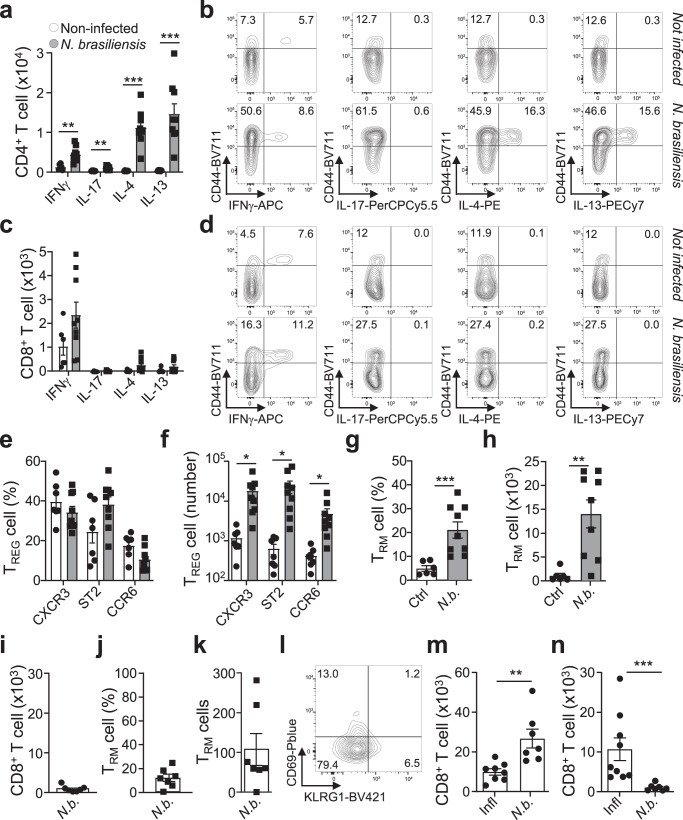
Fig. 2. Type-2 Nippostrongylus brasiliensis infection does not yield CD8 TRM cell formation.
Mice were subcutaneously infected or not with 300 stage L3 larvae of Nippostrongylus brasiliensis. 7 days post-infection lungs were collected, and cells were isolated and analysed via flow cytometry for cytokine production, and TRM cells. a Numbers of activated (CD44+) CD4+ T cells producing indicated cytokines, p(Non-infected vs Nippostrongylus brasiliensis): IFN-γ, p = 0.001749; IL-17, p = 0.002537; IL-4, p = 0.000048; IL-13, p = 0.000729, and b representative flow cytometry plots (non-infected n = 6, infected n = 9, N = 3). c Numbers of activated CD8+ T cells producing indicated cytokines and d Representative flow cytometry plots of cytokine production in CD8+ T cells (non-infected n = 6, infected n = 9, N = 3). e, f Foxp3WT mice were assessed for e percentage and f numbers of chemokine receptors CXCR3, ST2 (IL-33R) and CCR6 expression on TREG cells, p(Non-infected vs Nippostrongylus brasiliensis): CXCR3, p = 0.014118; ST2, p = 0.023778; CCR6, p = 0.028885, (non-infected n = 6, infected n = 9, N = 3). g, h CD69+KLRG1− CD8+ TRM cell g percentage of total CD8+ T cells, p(Non-infected vs Nippostrongylus brasiliensis) = 0.0004, and h number, p(Non-infected vs Nippostrongylus brasiliensis)= = 0.0016, in non-infected (control) and infected mice (non-infected n = 6, infected n = 9, N = 3). i–l Foxp3WT mice received CD8CD45.1 T cells intravenously, one day prior to infection. 14 days post-infection, lung cells were analysed via flow cytometry for i total number of CD8CD45.1 T cells, CD69+KLRG1− CD8+ TRM cell j percentage and k numbers, and l representative flow plot, within the CD8CD45.1 T-cell population (n = 7, N = 3). m, n Comparison of transferred CD8CD45.1 T-cell number in the (m) spleen, p(Influenza vs Nippostrongylus brasiliensis) = 0.0012, or (n) lungs, p(Influenza vs Nippostrongylus brasiliensis) = 0.0002, of mice infected with Influenza and N. brasiliensis (Influenza n = 9, N. brasiliensis n = 7, N = 3). 2-sided Mann–Whitney analysis was applied to compare the differences between groups. Data is presented as bars of mean ± SEM with single data points.

