Figure 5.
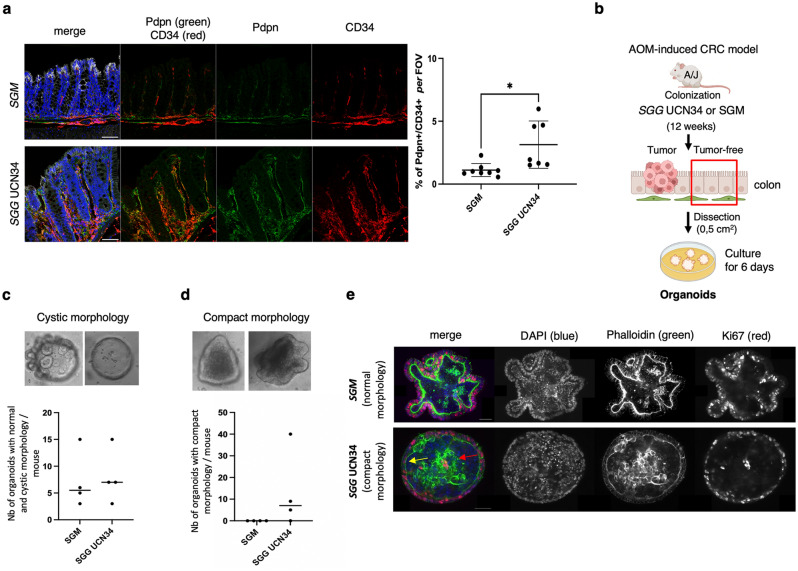
SGG UCN34 induces pre-cancerous transformation of murine colon tissue. (a) Immunofluorescence analysis of Pdpn (green) and CD34 (red) in sections of colonic tumor-free regions of mice colonized with SGM (top) or SGG UCN34 (bottom) (DAPI/nuclei in blue and E-cadherin in grey). Scale bar 50 µm. Images were acquired with SP8 microscope (Leica) and a ×40 objective. Graph presents the percentage of colocalization of Pdpn and CD34 signals per field of view (FOV). The quantification was done by Imaris (version8) software on SGM (n = 8) and SGG UCN34 (n = 7) colonized mice, using at least 6 images per mouse and showing 1.1% vs 3.1% of Pdpn + CD34 + signal respectively (*t-test p = 0.01). (b) Experimental design of ex vivo organoid formation originating from macroscopically tumor-free sections of colon tissue colonized by SGG UCN34 or SGM over 12 weeks in the AOM-induced CRC model. (c) The number of organoids with normal or cystic morphology defined as colonospheres or colonoids with a central empty lumen and polarized epithelium (actin staining). (d) The number of organoids with compact morphology defined as colonospheres or colonoids with a lumen full of cells and depolarized, restructured actin filaments. (e). Microscopic pictures showing DAPI/nuclei labeling (blue), Phalloidin/actin (green) and Ki67/proliferation marker (red). Images were acquired with Opterra Multipoint Scanning Confocal microscope (Bruker) at ×63 objective and analyzed by Fiji software. Scale bar 50 µm.

