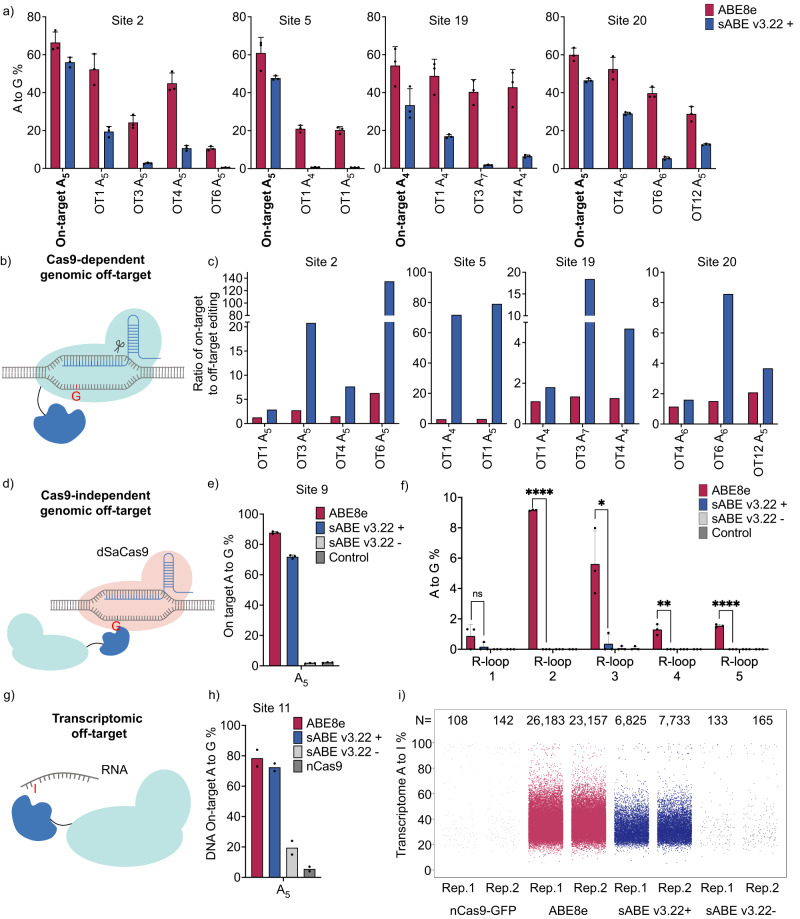
Fig. 3. Genomic and transcriptomic off-target effects in mammalian cells.
a A-to-G editing efficiencies on adenine in the conventional A4-A8 editing window in HEK293T cells by ABE8e or sABE v3.22 at four DNA on-target loci and eleven Cas9-dependent DNA off-target loci. OT: off-target. n = 3 b Schematic of Cas9-dependent genomic off-target effects by ABEs. c The ratio of on-target to off-target A-to-G editing efficiencies using data from a. d Schematic of orthogonal R-loop assay for detecting Cas9-independent DNA genomic off-target effects by ABEs. dSaCas9: dead Staphylococcus aureus Cas9. e DNA on-target A-to-G editing efficiencies in the R-loop assay by ABE8e or sABE v3.22. n = 3. f Cas9-independent off-target DNA A-to-G conversions detected by the orthogonal R-loop assay. High-throughput sequencing reads consisting of <0.2% of total reads were not considered. n = 3. P-values from left to right are 0.199873, <0.000001, 0.015994, 0.003168, and 0.000012. g Schematic of transcriptomic off-target effects by ABEs. h DNA on-target A-to-G editing efficiencies in the RNA-seq experiment, evaluated by Sanger sequencing. n = 2 i Jittered strip plots representing frequencies of A-to-I and T-to-C variations identified from RNA-seq experiments where HEK293T cells were transfected with ABE8e, sABE v3.22, or nCas9. Each dot represents an individual A-to-I or T-to-C variation at an individual nucleotide. T-to-C variations were considered as A-to-I variations on the Crick strand because strand-sensitive RNA-seq data were aligned to only the Watson strand. N is the total number of A-to-I and T-to-C single nucleotide variations identified. Rep: individual biological replicate. In a, e, f, and h, dots represent individual biological replicates, and bars represent mean ± s.d. In c, bars represent the ratio of mean values of on-target efficiencies to mean values of off-target efficiencies using data from a. f Uses the multiple unpaired two-tailed t-test; ns, not significant; *P < 0.05; **P < 0.01; ***P < 0.001; ****P < 0.0001.

