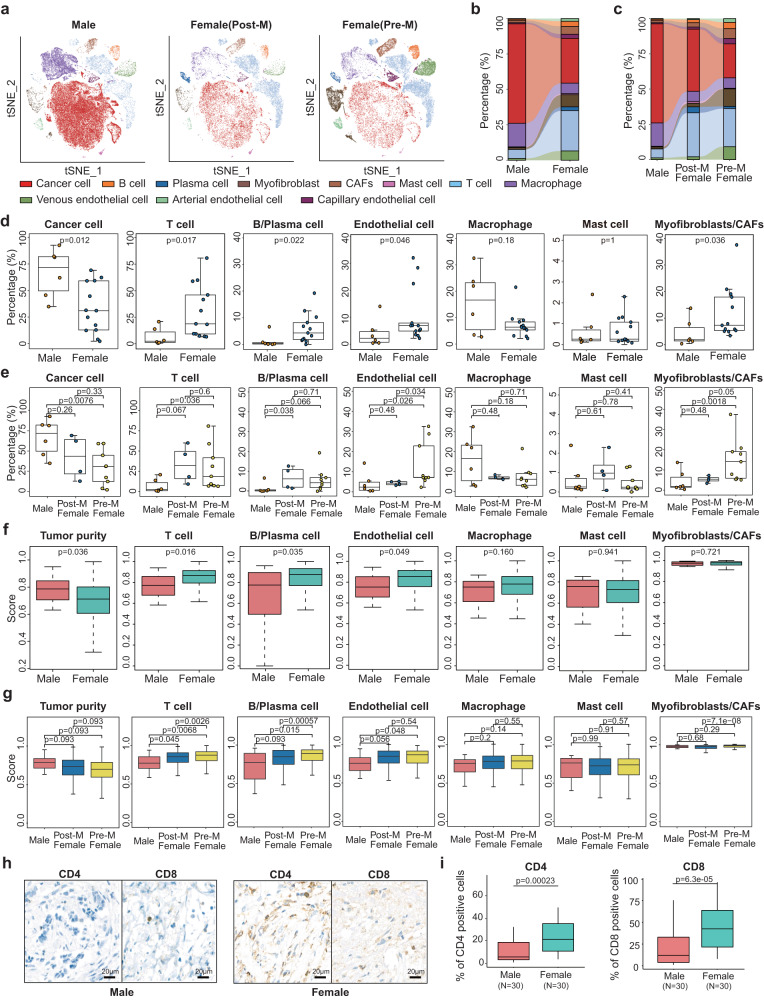
Fig. 2. Comparison of cellular components between MBC and FBC samples.
a The t-SNE plot of MBC, postmenopausal and premenopausal FBC samples. Colors represent cell types. b Sankey diagram showing the fraction of each cell type between male and female samples. c Sankey diagram showing the fraction of each cell type between MBC, postmenopausal and premenopausal FBC samples. d Boxplot showing the percentage of cancer cells, T cells, B/Plasma cells, endothelial cells, macrophages, mast cells and myofibroblasts/CAFs in MBC (n = 6) and FBC (n = 13) samples. P value was calculated by two-sided Wilcoxon rank-sum test. e Boxplot showing the percentage of cancer cells, T cells, B/Plasma cells, endothelial cells, macrophages, mast cells and myofibroblasts/CAFs in MBC (n = 6), postmenopausal (n = 4) and premenopausal (n = 9) FBC samples. P value was calculated by two-sided Wilcoxon rank-sum test. f Boxplot showing the tumor purity and signature scores of various cell types between MBC (n = 12) and FBC (n = 710) in TCGA ER+ BRCA cohort. P value was calculated by two-sided Wilcoxon rank-sum test. g Boxplot showing the tumor purity and signature scores of various cell types between MBC (n = 12), postmenopausal (n = 337) and premenopausal (n = 372) FBC samples in TCGA ER+ BRCA cohort. P value was calculated by two-sided Wilcoxon rank-sum test. h Representative images of IHC staining detecting T cell markers CD4 and CD8 expression in MBC (n = 30) and FBC (n = 30) samples, Scale bar, 20 μm. i Boxplot indicating the IHC scores of CD4 and CD8 in 30 ER+ male (lightcoral) and 30 ER+ female (turquoise) patients (identified by the percentage of positive cells). P value was calculated by two-sided Wilcoxon rank-sum test. In d–g and i, box plots show median (center line), the upper and lower quantiles (box), and the range of the data (whiskers). Source data are provided as a Source data file.

