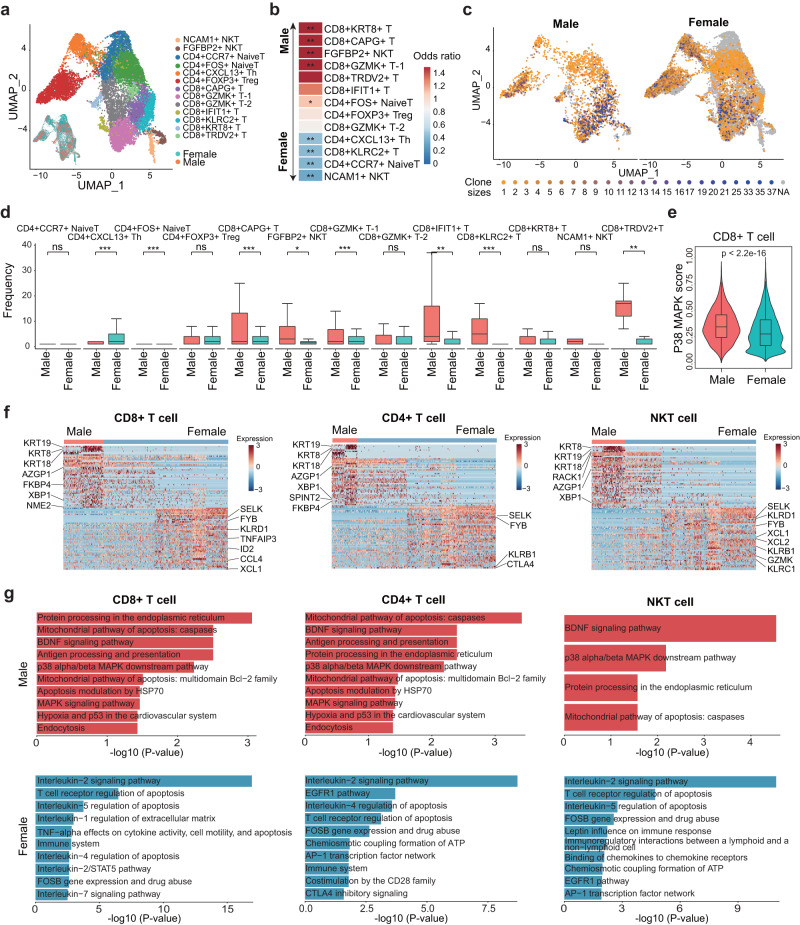
Fig. 5. Characterization of subpopulations and clone sizes of T cells in MBC and FBC samples based on scRNA-seq and scTCR-seq.
a UMAP plot showing the subpopulations of T cells. b Heatmap showing the odds ratio of each T cell subpopulation calculated by Fisher’s exact test. *P < 0.05; **P < 0.01. Red color represents subpopulations enriched in MBC samples, and blue color represents subpopulations enriched in FBC samples. c UMAP plot showing the clone sizes of T cells in MBC (left) and FBC (right) samples. d Boxplot showing the TCR clone sizes of T cell subpopulations in MBC (n = 3031 cells) and FBC (n = 12,659 cells) samples. Lightcoral represents male and turquoise represents female. P value was calculated by two-sided Wilcoxon rank-sum test. *P < 0.05; **P < 0.01; ***P < 0.001; ns: P > 0.05. e Violin plot of p38 MAPK activity in CD8 + T cells from MBC (n = 1664 cells) and FBC (n = 5248 cells) samples. Lightcoral represents male and turquoise represents female. P value was calculated by two-sided Wilcoxon rank-sum test. f Heatmap showing the differentially expressed genes between MBC and FBC T cells, including CD4 + , CD8 + , and NKT cells. g The significant pathways enriched by the differentially expressed genes. Biological pathways in BioPlanet database were used in the enrichment analysis. Red color represents pathways enriched in MBC samples, and blue color represents pathways enriched in FBC samples. In d, e, box plots show median (center line), the upper and lower quantiles (box), and the range of the data (whiskers). Source data are provided as a Source data file.

