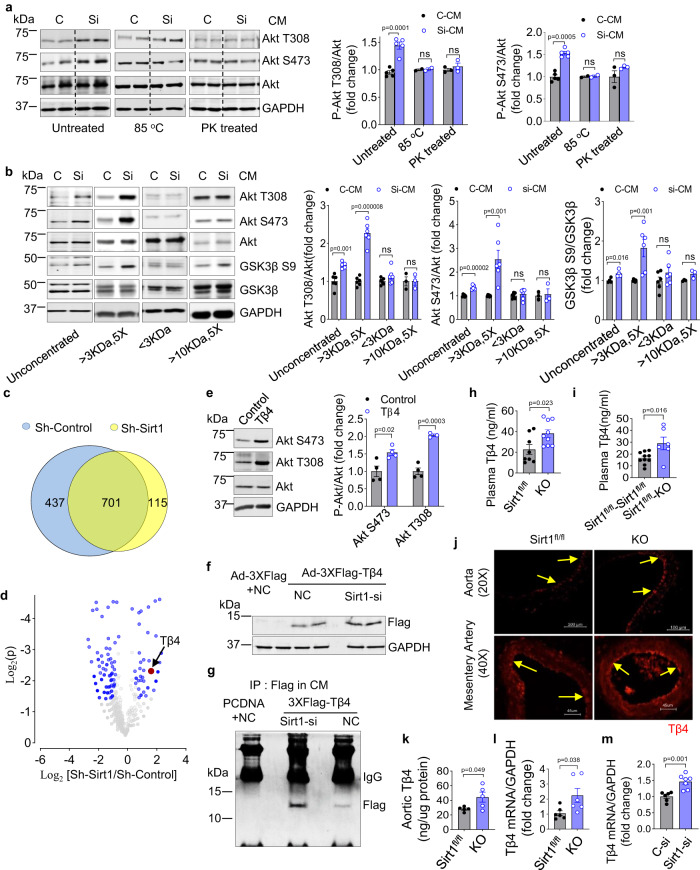
Fig. 4. Deficiency of Sirt1 augments Tβ4 in the endothelial secretome, and male mice lacking endothelial Sirt1 have higher vascular and plasma Tβ4.
a, b The secretome of endothelial cells in which Sirt1 is silenced boosts Akt signaling in skeletal myoblasts via a small protein. a Akt phosphorylation in C2C12 myotubes incubated with conditioned medium of Sirt1-silenced and control HUVECs that is untreated (n = 5 independent experiments), denatured by heating (n = 2 independent experiments) or treated with proteinase K (n = 3 independent experiments, ns p > 0.05); and (b) Akt and GSK3β phosphorylation in C2C12 myotubes incubated with conditioned medium subjected to size-exclusion filtration. The conditioned medium was collected from Sirt1-silenced and control HUVECs and subjected to size-exclusion filtration. The groups include unconcentrated group (C-CM, n = 6 independent experiments) vs. si-CM (n = 5 independent experiments), >3kDa 5X group (C-CM, n = 6 independent experiments) vs. si-CM (n = 6 independent experiments), <3kDa group (C-CM, n = 6 independent experiments) vs. si-CM (n = 6 independent experiments), and >10kDa 5X group (C-CM, n = 3 independent experiments) vs. si-CM (n = 3 independent experiments). ns p > 0.05. Representative blots are shown. c, d Proteomics showing upregulation of Tβ4 in CM of Sirt1-silenced HUVECs. c Venn diagram of proteins identified in secretomes of CM of HUVECs transfected with control-siRNA (Sh-Control) and Sirt1-siRNA (Sh-Sirt1). d Volcano plot of proteins in secretomes of CM of Sh-Control and Sh-Sirt1 HUVECs. Relative up- and down-regulation of secreted proteins are expressed as Log2 [Sh-Sirt1/Sh-Control], and significance of change in expression as log2 p value. A total of 183 proteins (blue dots, p < 0.05) showed significantly different expression. e Recombinant Tβ4 (40 ng/mL for 40 min) stimulates Akt phosphorylation in C2C12 myotubes (control, n = 4 independent experiments) vs. Tβ4 (n = 4 independent experiments). Representative blots with quantification are shown. f–m Deficiency of endothelial Sirt1 boosts Tβ4 expression and secretion. f, g Sirt1 downregulation (si-Sirt1) increases exogenous Flag-tagged Tβ4 immunoprecipitated in CM of HUVECs. Representative blots are shown. h Plasma Tβ4 is upregulated in KO mice (n = 9) vs. Sirt1fl/fl (n = 8), p = 0.023. i Plasma Tβ4 is upregulated in Sirt1fl/fl mice parabiosed with KO mice (n = 6) vs. Sirt1fl/fl mice parabiosed with Sirt1fl/fl mice (n = 10), p = 0.016. j Immunofluorescent staining showing upregulation of Tβ4 (red) in aorta and mesenteric artery endothelium (yellow arrows) of E-Sirt1-KO mice; representative images are shown. k Tβ4 protein is upregulated in aortas of KO mice (n = 5) vs. Sirt1fl/fl mice (n = 5), p = 0.049. l Tβ4 mRNA is upregulated in aortas of KO mice (n = 6) vs. Sirt1fl/fl mice (n = 6), p = 0.038. m Silencing of Sirt1 (Sirt1-Si) in HUVECs stimulates Tβ4 mRNA expression (C-si, n = 6 independent experiments) vs. Sirt1-si (n = 7 independent experiments), p = 0.001. CM conditioned medium, Sirt1-si Sirt1 siRNA, Tβ4-si Tβ4 siRNA, Tβ4 Thymosin beta 4, C control siRNA, Si Sirt1 siRNA, PK proteinase K, NC control siRNA, IP immunoprecipitation, Sirt1fl/fl Sirt1flox/flox mice, KO E-Sirt1-KO mice. Data are shown as mean ± SEM. Two-tailed unpaired Student’s t test was used. In (a, b, and m), gray bars represent control-CM treated groups, and blue bars represent si-CM treated group. Each dark dot or blue circle represents one sample. In (h, i, k and l), gray bars represent Sirt1fl/fl group, and blue bars represent KO group. Each dark dot or blue circle represents one sample. Source data are provided as a Source Data file.

